Gate Research: ETF Inflows and Short Covering in Resonance|BTC and ETH Enter a Trend Expansion Phase
Summary
-
Over the past two weeks, the crypto market has shifted from a post-deleveraging compressed state to a low-crowding recovery phase. BTC rose about 2.2% within the range, and ETH about 9.5%. From the stage low to high, BTC and ETH reached approximately 15.8% and 24.9% respectively, with ETH becoming the amplified beta in this rebound.
-
Derivative structure shows that this rally was not driven by high-leverage long chasing, but rather by ETF inflows, short covering, and moderate leverage recovery. Over the past two weeks, BTC and ETH perpetual open interest increased by about 5.97% and 33.99% respectively, while funding rates continued to fluctuate around zero. Trend recovery is faster than sentiment recovery, and the market remains in a relatively healthy range overall.
-
The current market is more suitable for moving-average cluster breakouts. Based on the 4-hour SMA/EMA 6, 12, 24 combination, strategy returns under baseline parameters are approximately 6.84% for BTC and 9.05% for ETH. A combination of tighter compression thresholds and higher profit targets has performed better over the past two weeks, confirming that the market is shifting from sideways compression to trend release.
I. Market Overview
Over the past two weeks, BTC rose about 2.2% within the range, and ETH about 9.5%; measured from the stage low to high, BTC recovered about 15.8% and ETH about 24.9%. The total market capitalization is approximately $2.62 trillion, with BTC dominance at 56.7%. The Fear & Greed Index is only 26, indicating that price recovery is significantly faster than sentiment recovery, and the market is in a low-crowding recovery phase.
The core change is a structural shift rather than a simple rebound. In early March, the market first completed a round of deleveraging, with BTC stabilizing the structure first, followed by ETH amplifying the rebound. This is clearly confirmed by derivatives data: BTC perpetual open interest increased by only about 5.97% over two weeks, while ETH increased by about 33.99%. This suggests BTC currently acts more as a trend anchor, while ETH serves as the offensive leg as risk appetite recovers.
1.1 Price and Volatility
Figure 1: Past 2 Week: BTC and ETH Normalized Price
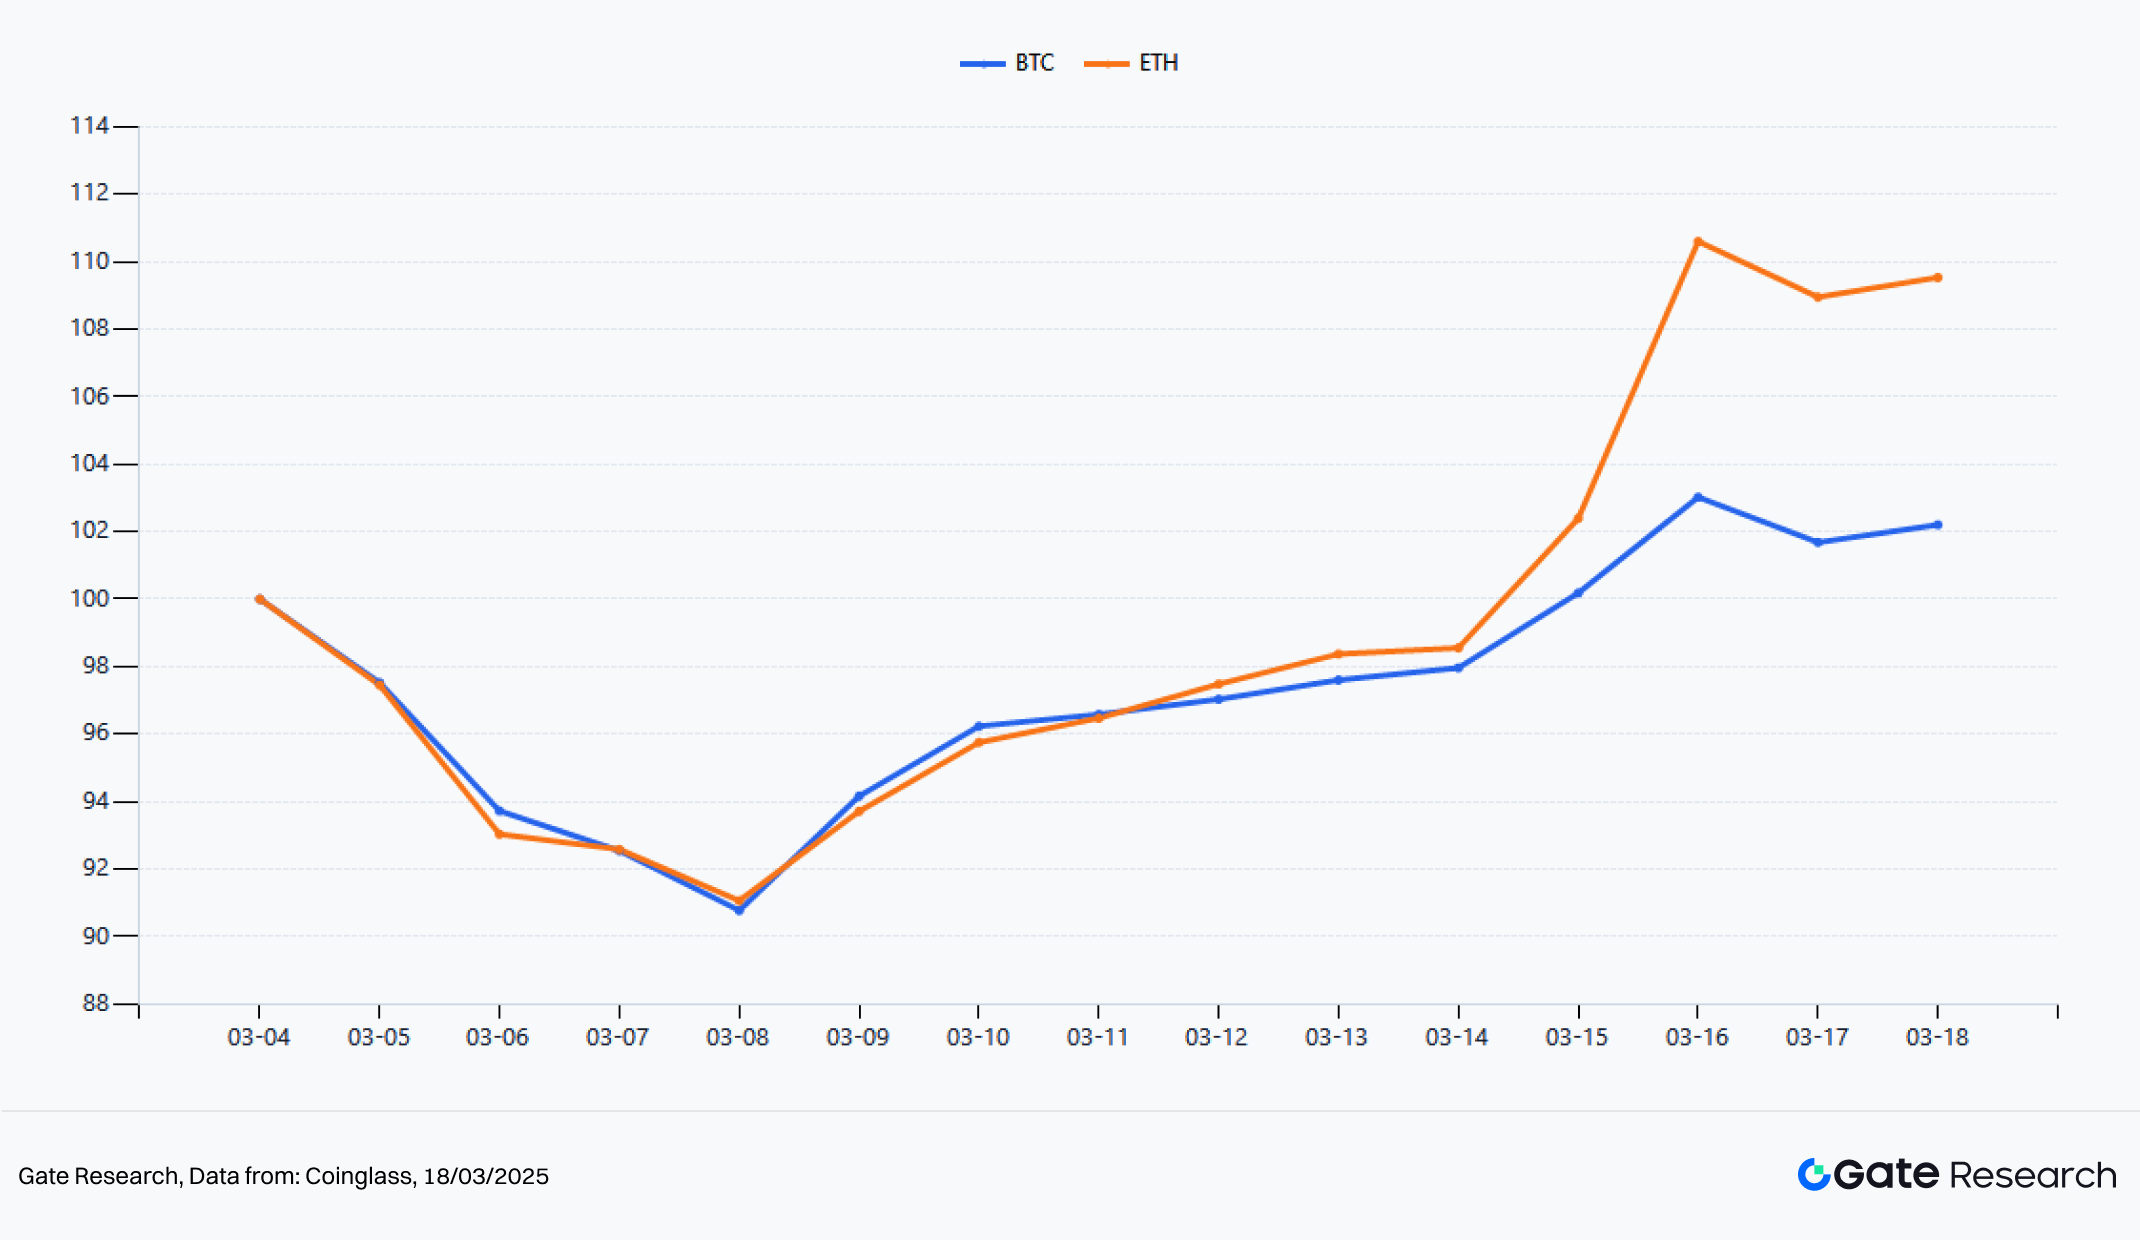
From the normalized trend, using March 4, 2026 as the 100 baseline, BTC returned to about 102.2 by March 18, while ETH returned to about 109.5. Both declined synchronously from March 4 to March 8, but ETH recovered faster in the second week, with a steeper price slope. In terms of amplitude, BTC fell to a low of $65,620 and rose to a high of $76,000 over the two weeks; ETH fell to a low of $1,910 and rose to a high of $2,385.66. The current market is not experiencing a broad-based rise, but rather a typical pattern where major assets stabilize first, followed by higher-beta secondary assets taking over.
Figure 2: Past 2 Week: BTC and ETH Daily Price Range
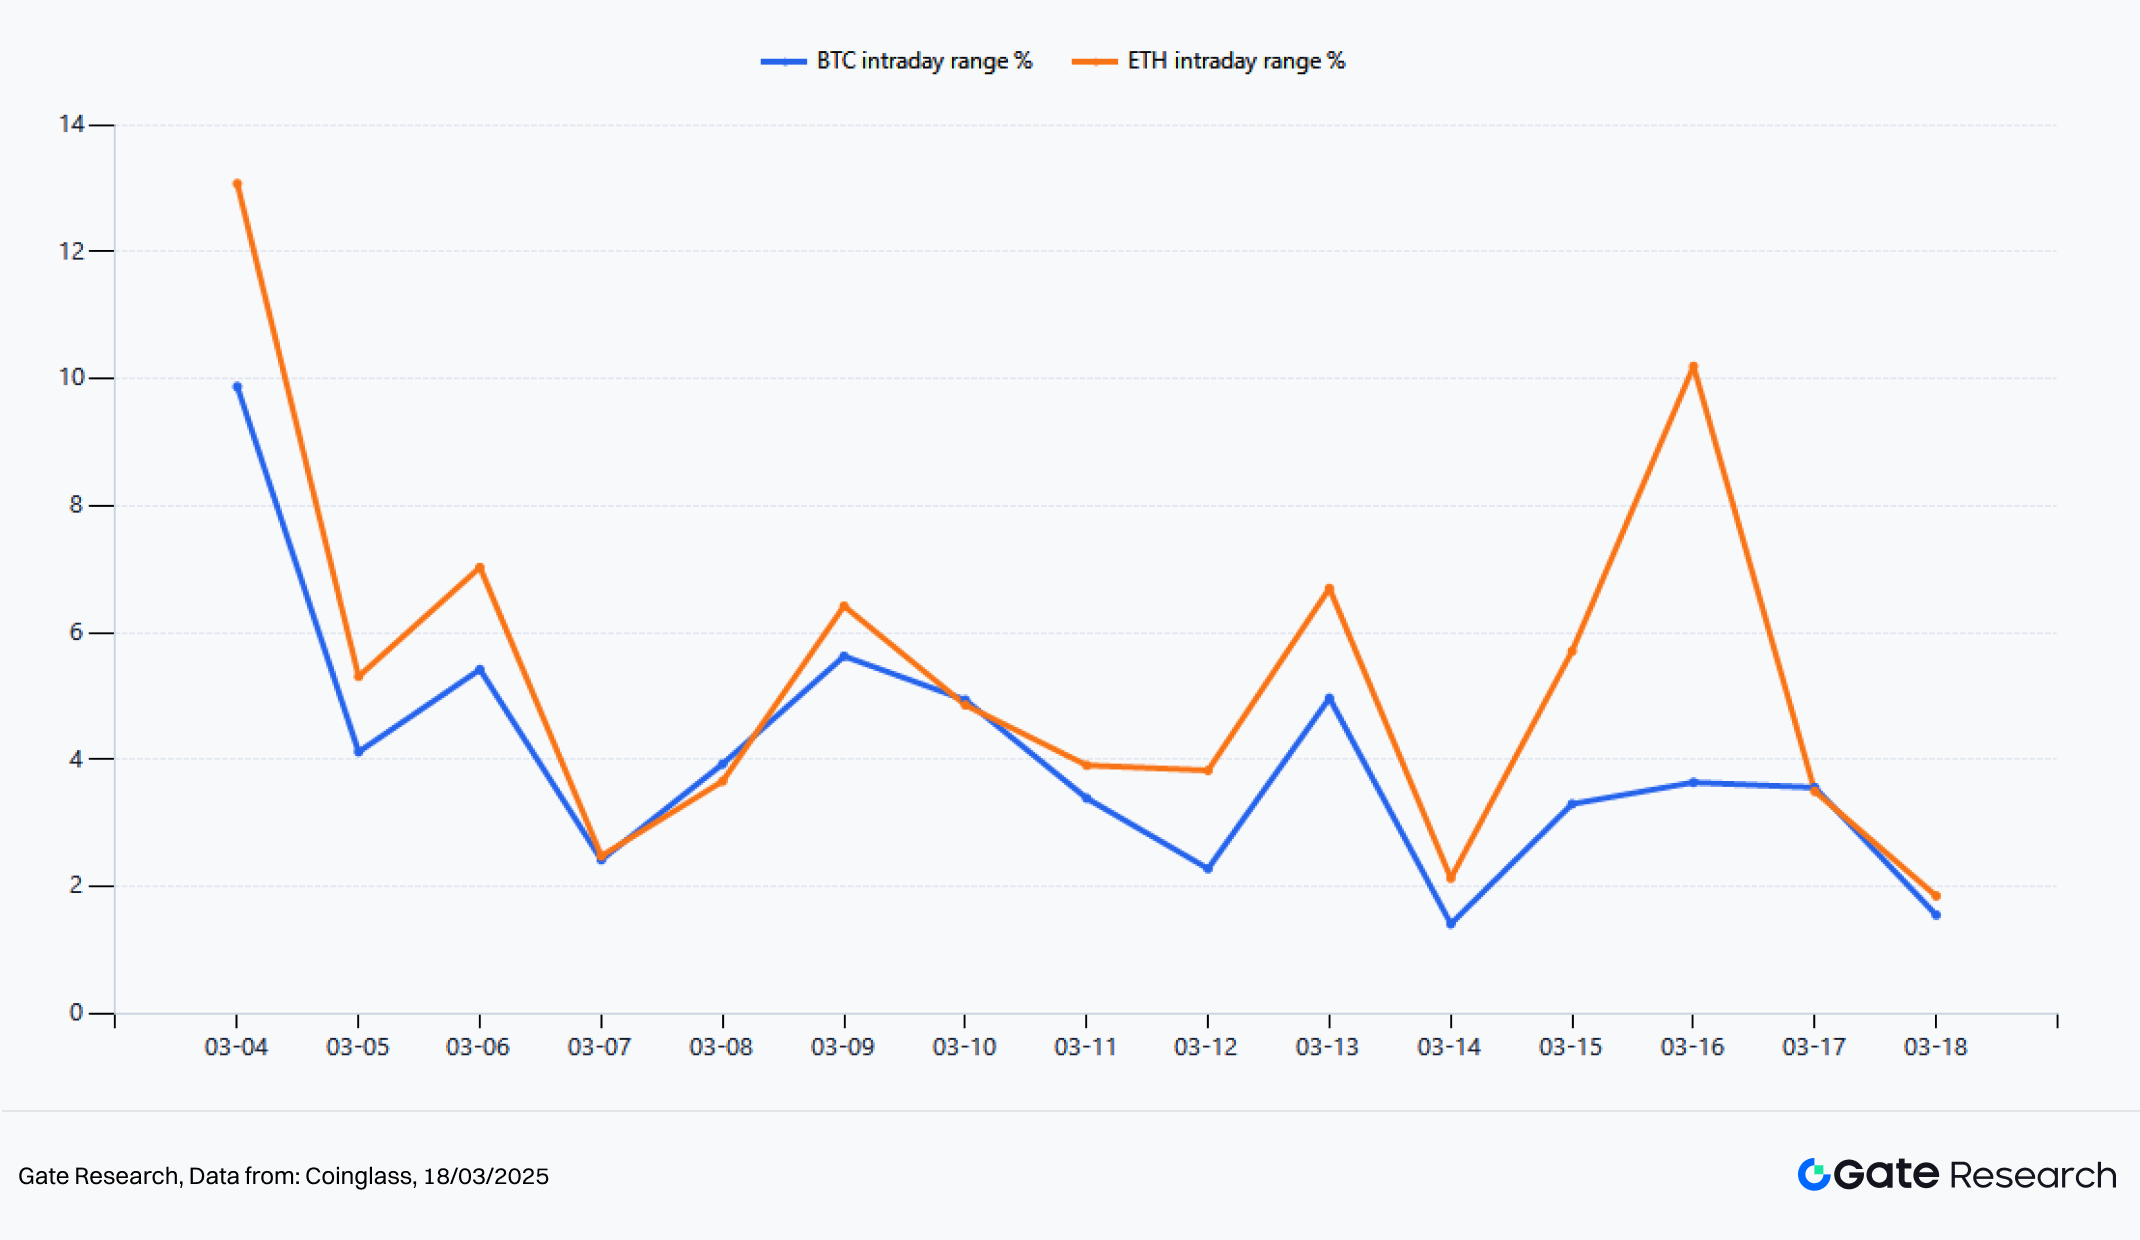
From a volatility perspective, both BTC and ETH exhibit a pattern of initial compression followed by release, but ETH shows significantly stronger elasticity. BTC rebounded from $72,681 to $74,276, with a range gain of about 2.2%; ETH rose from $2,127 to $2,329.9, with a range gain of about 9.5%. Measuring realized volatility by intraday highs and lows, BTC’s average intraday amplitude over the past two weeks was about 4.03%, with a peak of 9.88%; ETH’s average intraday amplitude was about 5.38%, with a peak of 13.08%. In this recovery phase, BTC plays the role of restoring the price center, while ETH has clearly entered a trend-following state after volatility expansion.
1.2 Long-Short Trading Analysis
Figure 3: Perpetual Futures Account Long/Short Ratio
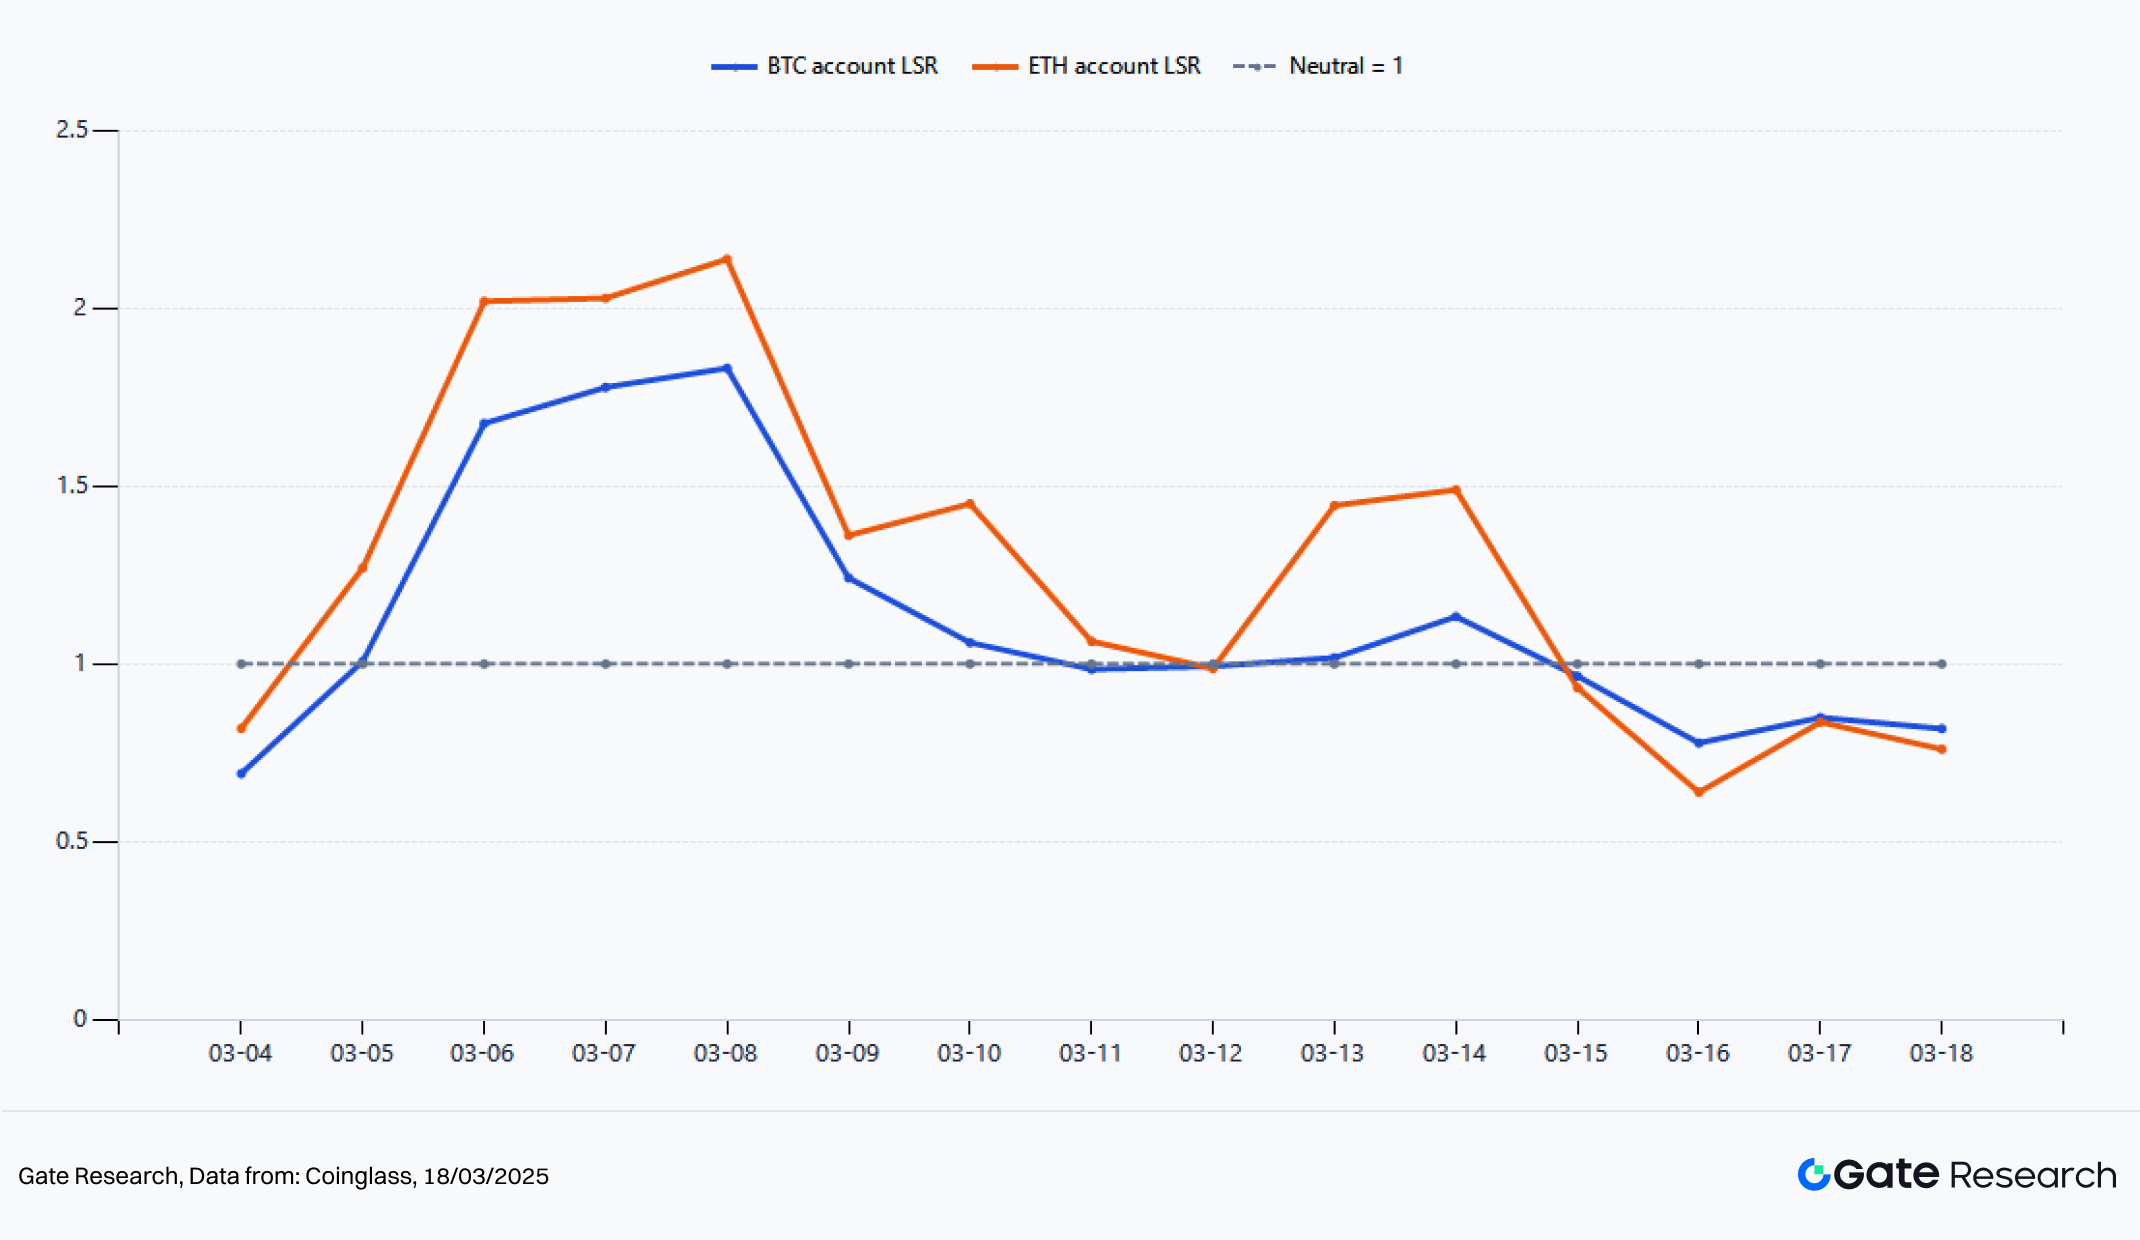
From the perspective of the long-short ratio of perpetual contract accounts, the market first experienced a clear bottom-fishing sentiment over the past two weeks, followed by a rapid return to caution. BTC’s account long-short ratio once rose to 1.832 in the early stage of the window, while ETH reached a peak of 2.139. During the sharp pullback from March 6 to 8, there was concentrated bottom-fishing activity. In terms of the two-week average, BTC’s account long-short ratio was about 1.122, and ETH’s about 1.283, indicating that ETH had a stronger overall bullish bias, reflecting stronger directional bets by trading capital.
However, as prices stabilized again, the LSR did not continue to rise but instead declined steadily. As of March 18, the account long-short ratios of BTC and ETH had dropped to 0.818 and 0.760 respectively, falling back below 1. This does not indicate that the market has turned bearish; rather, it suggests that this rally is not driven by continuous long chasing from retail accounts, but more by short covering and incremental spot inflows. In other words, retail willingness to chase higher prices is declining, yet prices are still holding at elevated levels, indicating that the market structure remains strong. If the LSR rises again from low levels while prices simultaneously break previous highs, it often signals that a new wave of trend-following capital is entering the market.
1.3 Open Interest and ETF
Figure 4: Perpetual Futures Open Interest (USD)
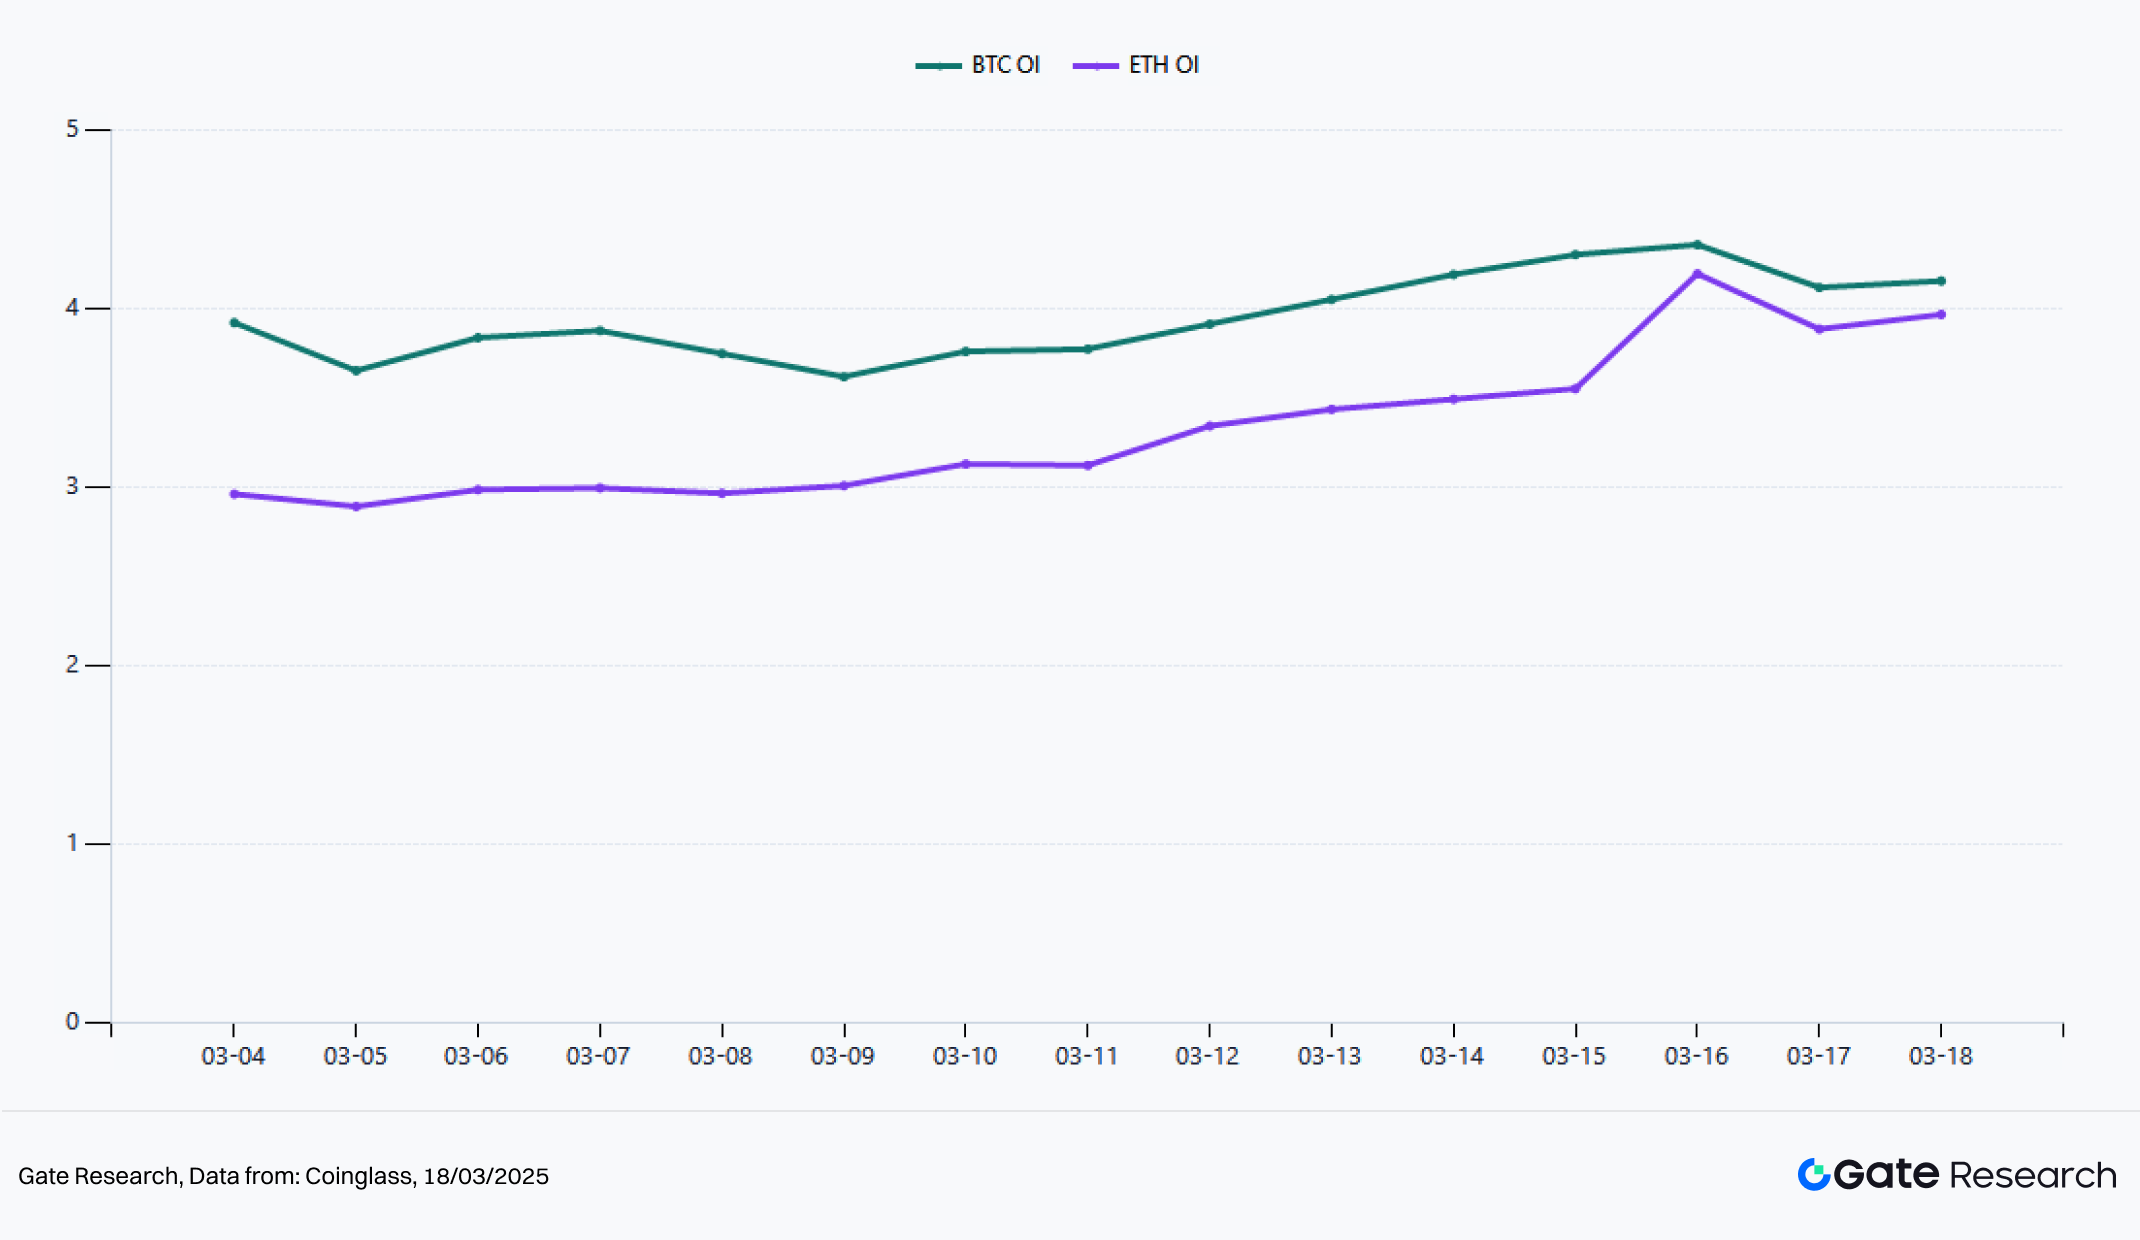
Changes in open interest are a key indicator for judging trend quality and the degree of leverage participation. Over the past two weeks, BTC perpetual open interest rose from about $3.92 billion to $4.154 billion, a cumulative increase of about 5.97%. The two-week average was about $3.95 billion. The peak reached $4.357 billion. ETH perpetual open interest rose from about $2.96 billion to $3.966 billion, a cumulative increase of about 33.99%. The two-week average was about $3.33 billion. The peak reached $4.194 billion.
Compared with BTC, ETH shows a much faster return of leverage. This indicates that after market stabilization, capital is more willing to take high-risk and high-elasticity directional exposure through ETH. From another perspective, the current rise of BTC does not rely on large amounts of new leverage. Its structure is more stable. It is closer to a mid-term trend recovery. The rise of ETH is accompanied by clear expansion in open interest. This shows a shift from a simple rebound to a phase of price increase supported by leverage. The current structure of ETH is favorable for amplifying short-term returns. It also means higher requirements for continued capital inflow. If trading activity and ETF inflows slowly, ETH usually experiences larger pullbacks than BTC. Therefore, from the perspective of open interest, BTC is more suitable as a trend anchor. ETH is more suitable as a high-elastic trading instrument.
Figure 5: Spot ETF Daily Net Flows
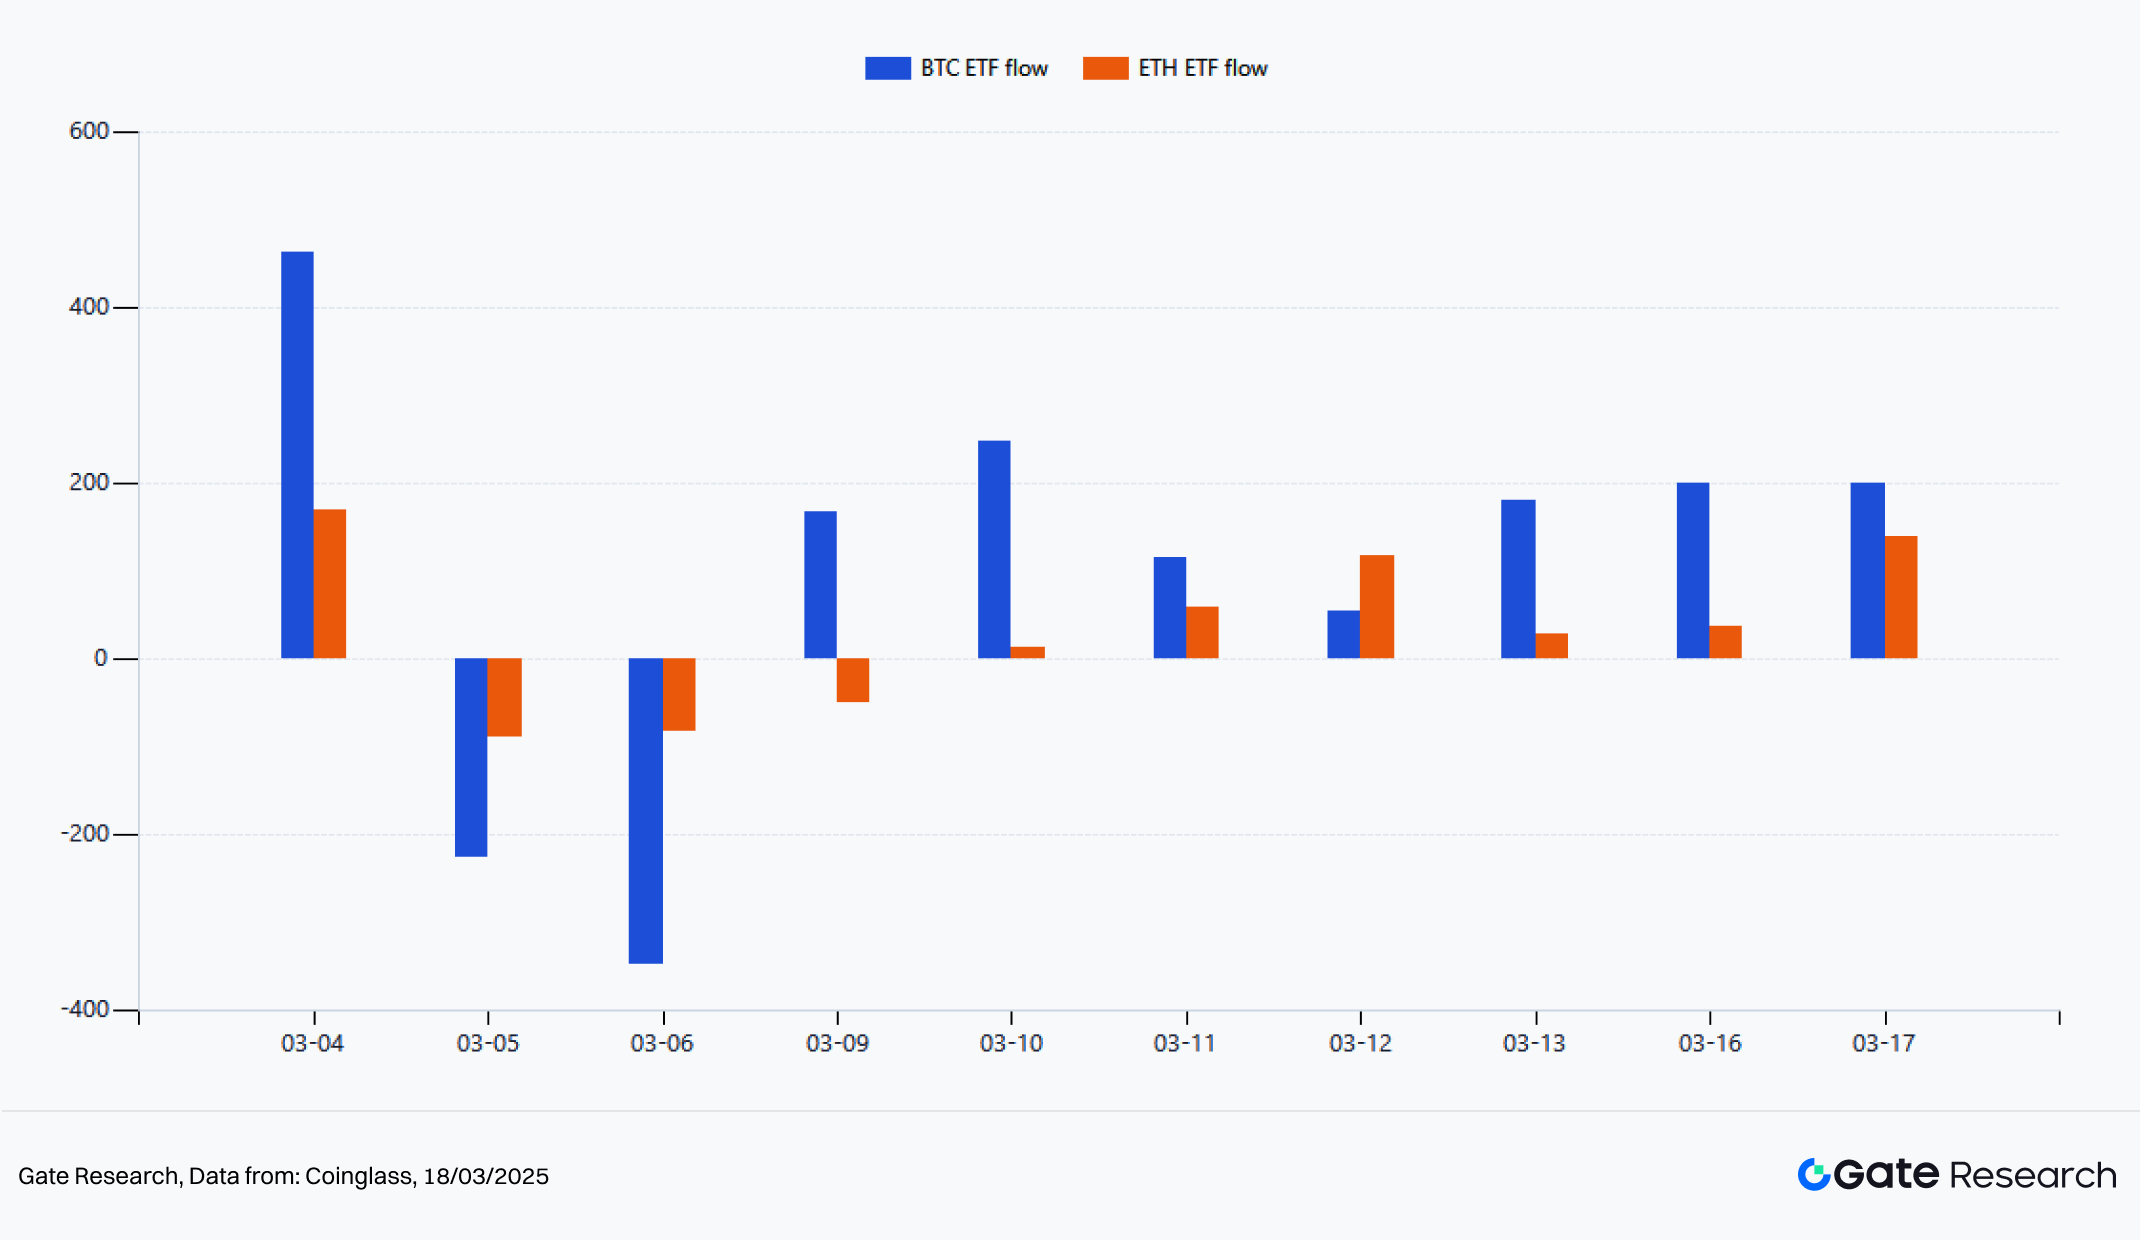
The positive news is that the most important external variable over the past two weeks has been the return of ETF inflows. BTC spot ETFs recorded a cumulative net inflow of about $1.047 billion during this period. ETH spot ETFs recorded a cumulative net inflow of about $331 million. In terms of timing, BTC saw consecutive large outflows on March 5 and March 6, then re-entered a phase of sustained net inflows after March 9. ETH was more volatile in the first half of the period, but improved significantly after March 12. On March 17, its single-day net inflow reached $138.2 million.
If the period is broken down, BTC still showed net outflows during the three trading days from March 4 to March 6. From March 9 to March 17, across seven trading days, cumulative net inflows reached about $1.161 billion. ETH recorded about $335 million over the same period. This indicates that the real turning point for institutional capital occurred in the second week. The flow strengthened BTC first, then spread to ETH.
1.4 Funding Rate
Figure 6: Daily Average Funding Rate
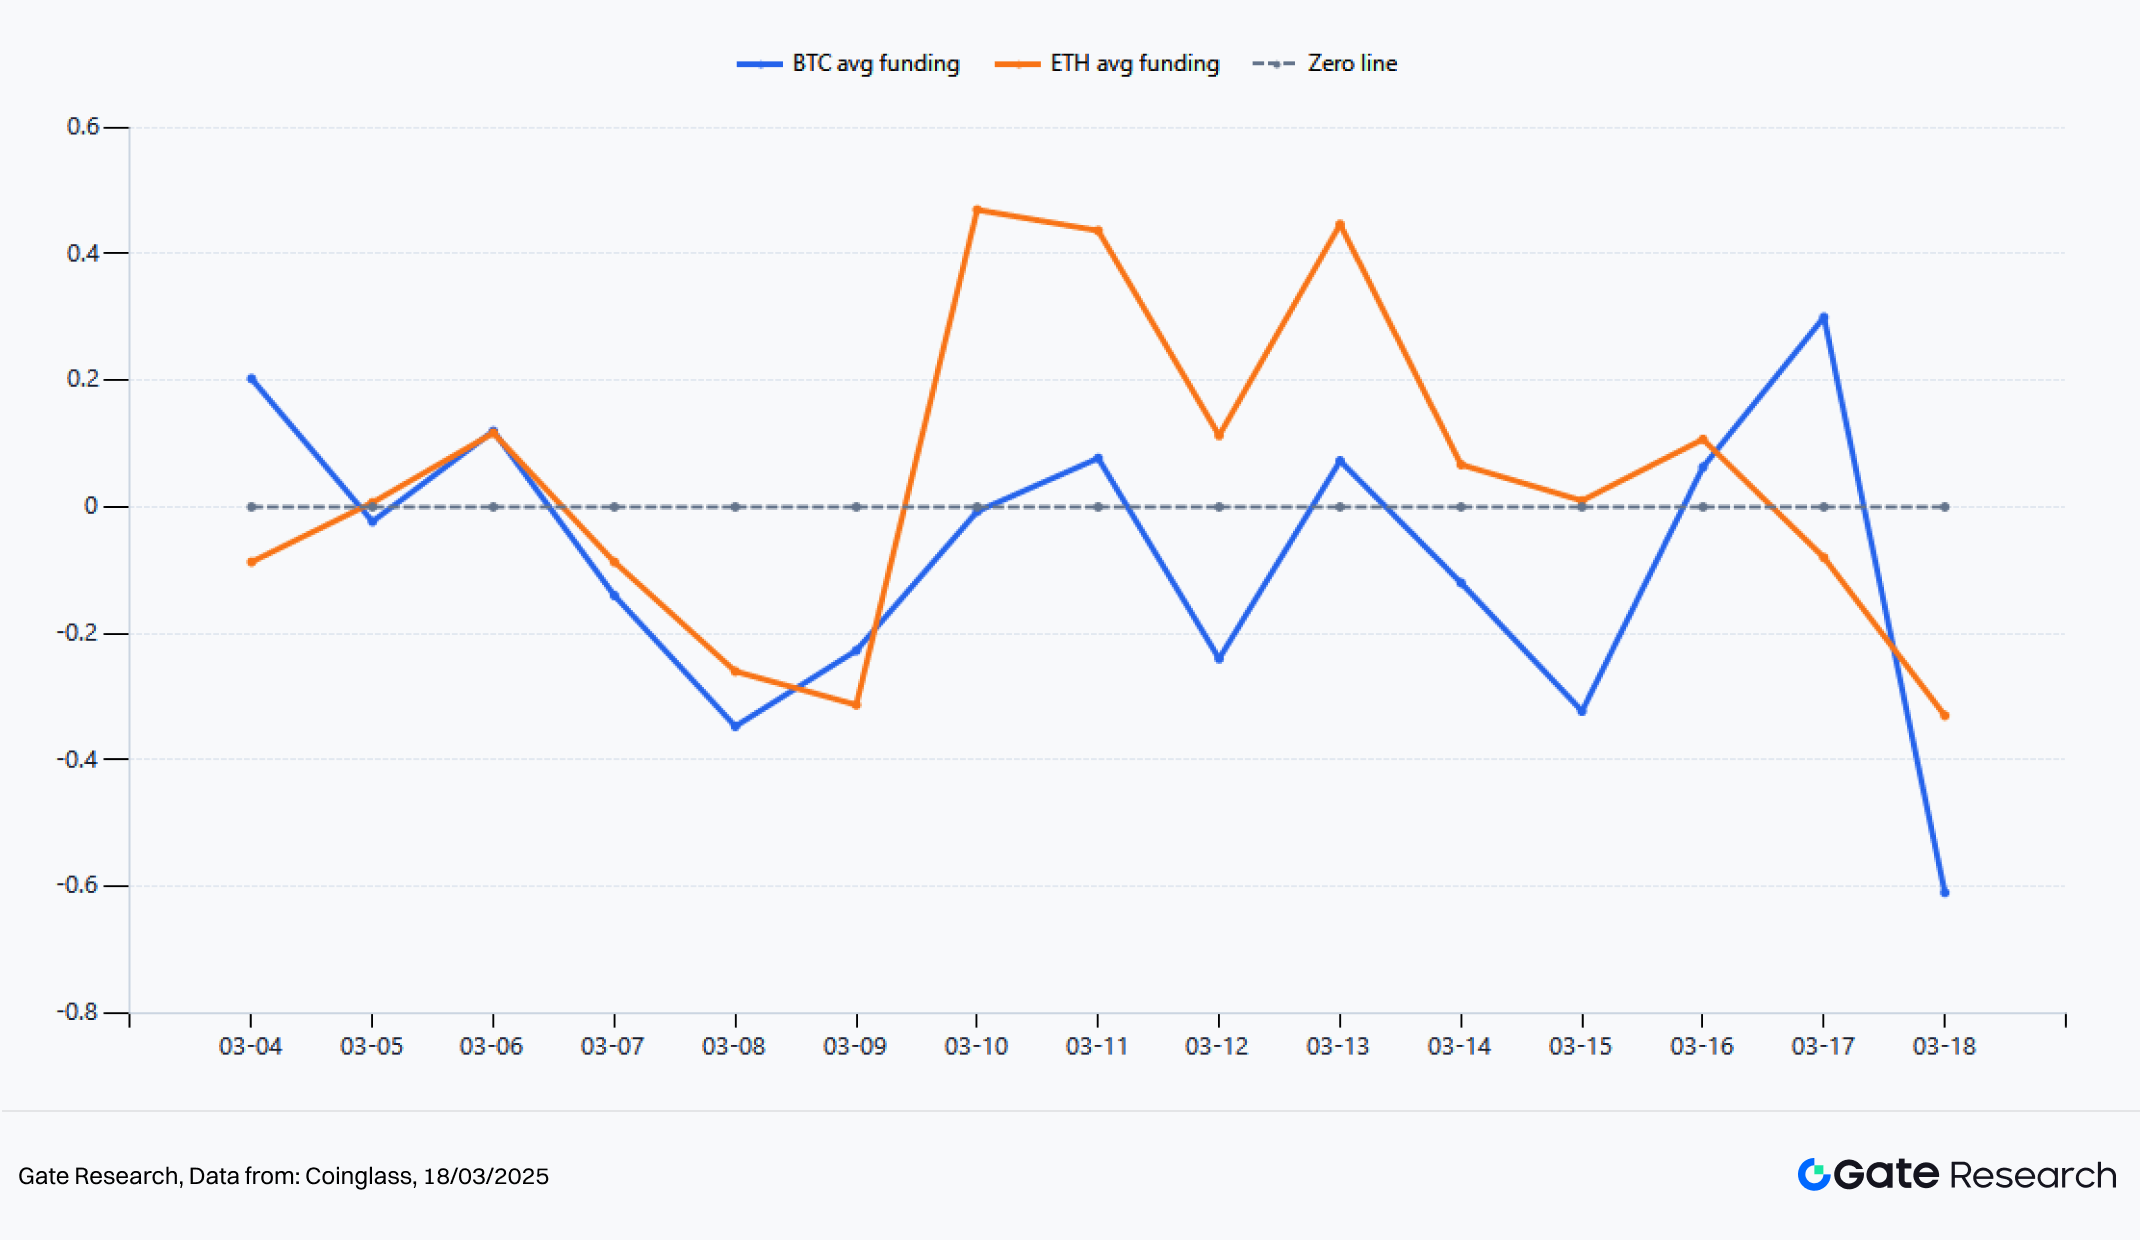
In terms of funding rates, the market has remained in a low-crowding state over the past two weeks. The average funding rate for BTC during this period was about -0.055 basis points, while ETH was about +0.058 basis points, both fluctuating slightly around the zero axis. At the extremes, BTC funding rates ranged from about +0.650 basis points to -0.640 basis points; ETH ranged from about +0.860 basis points to -1.470 basis points. It can be seen that although ETH showed stronger performance in the latter half, funding rates did not sustain high positive levels, and long positions did not become excessively crowded, leaving room for further upward movement.
From a time-structure perspective, BTC funding rates were more negative around March 8, reflecting that short positions or hedging activity dominated during the prior decline. After March 10, ETH funding rates stayed more frequently above the zero axis, indicating a gradual strengthening of long interest, though still at a moderate level. For trend assessment, this represents a relatively healthy combination. Prices have recovered, but funding rates have not overheated, suggesting that the current rise is driven more by genuine buying rather than excessive leverage in derivatives. If prices continue to rise while funding rates remain moderate, the probability of trend continuation is usually higher.
1.5 Liquidations
Figure 7: BTC and ETH Daily Liquidations
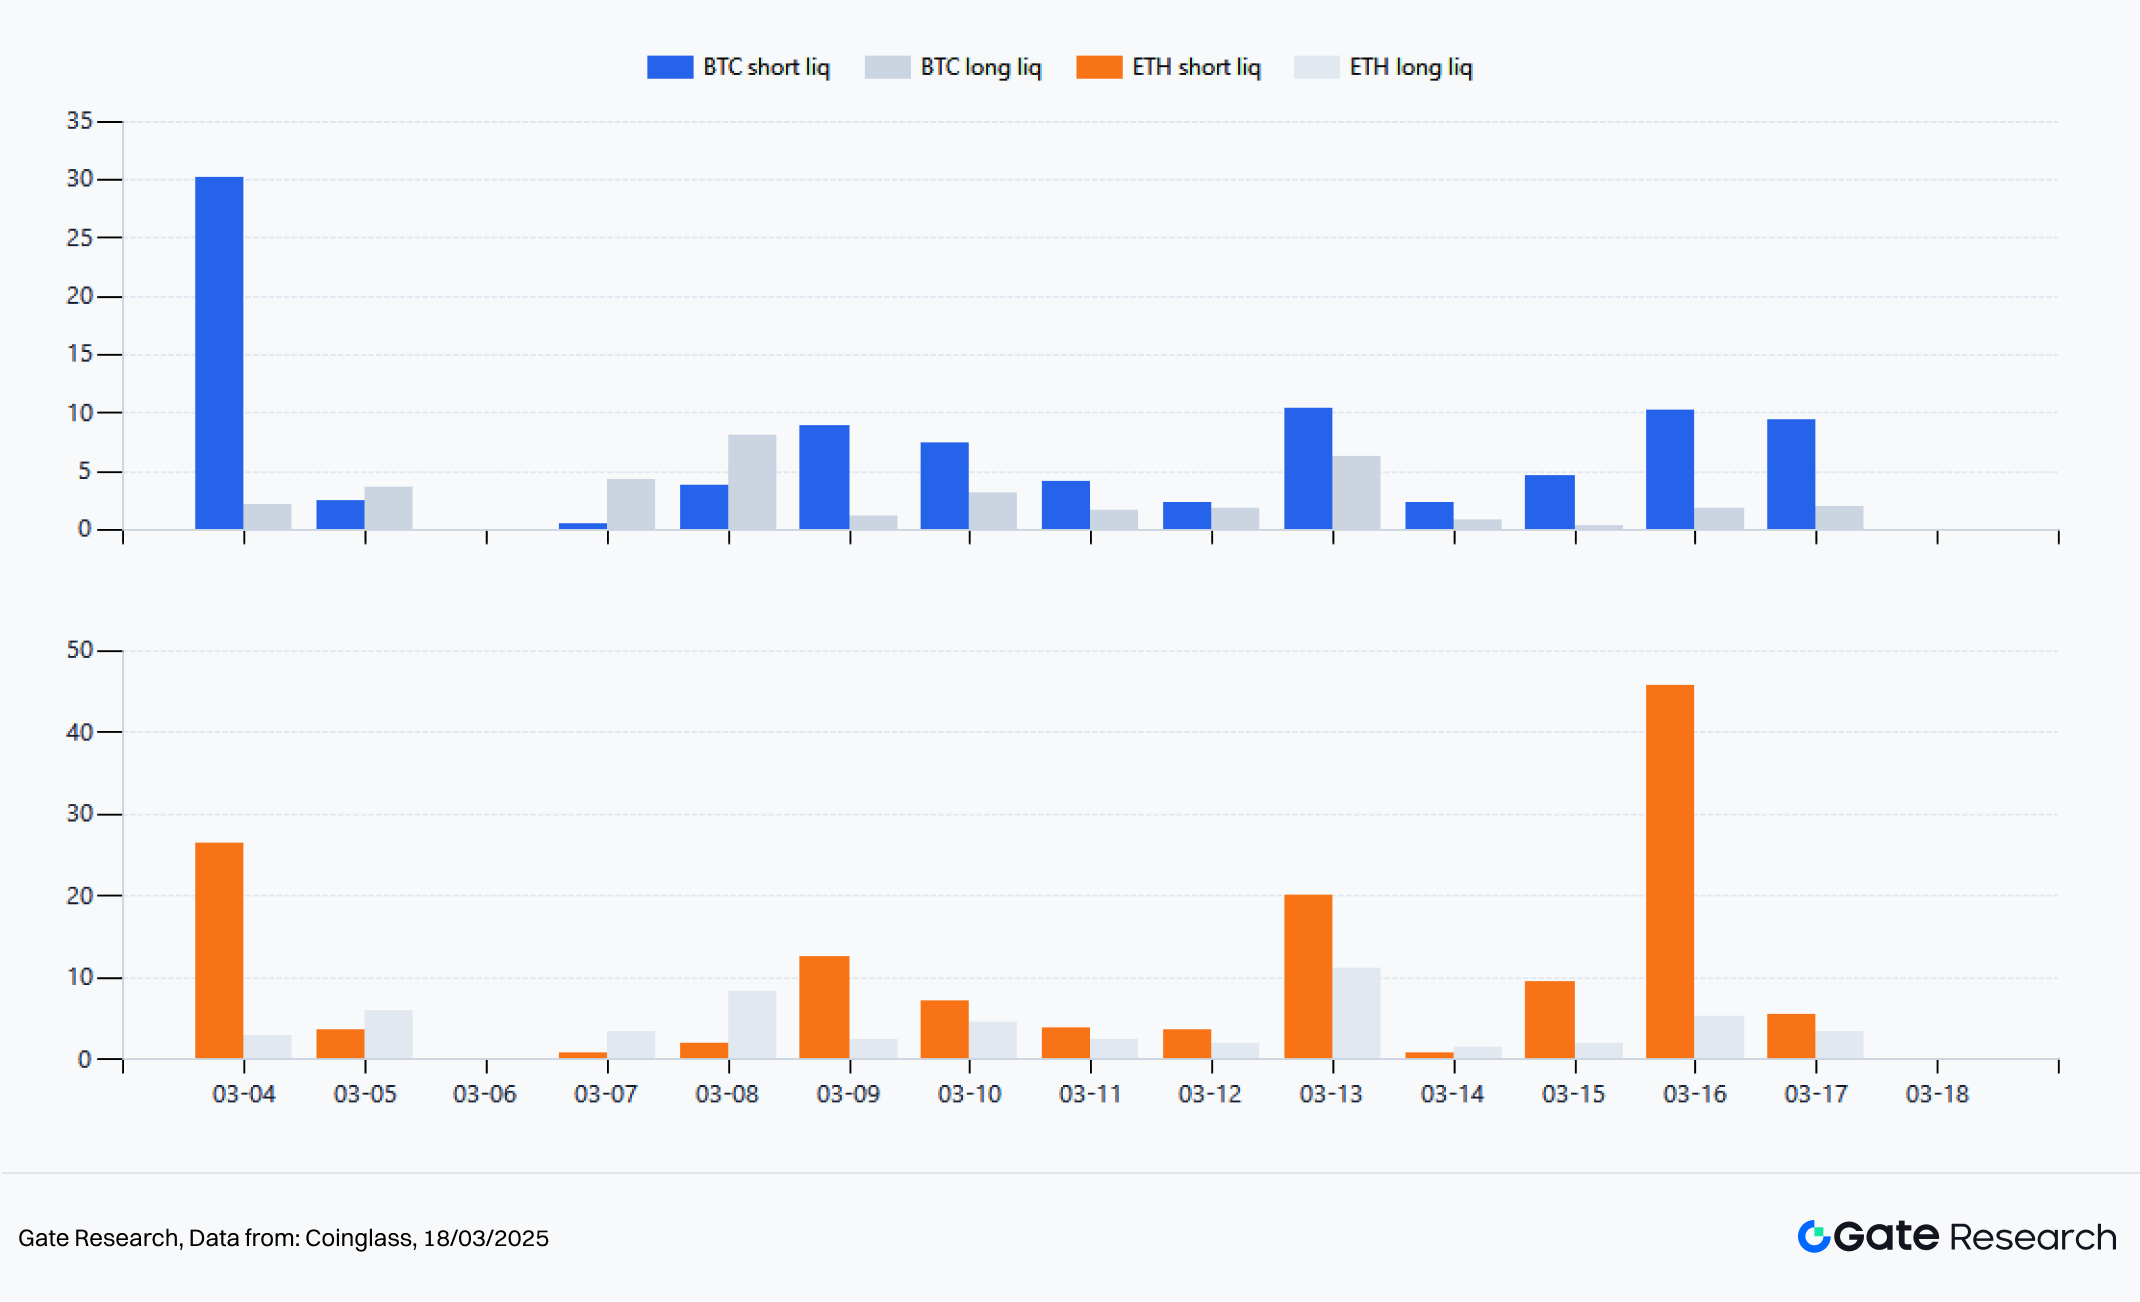
From the liquidation structure, both BTC and ETH showed characteristics of short-dominated liquidations over the past two weeks, with ETH displaying stronger intensity and a more pronounced amplification effect. In cumulative terms, total short liquidations for BTC were about $96.22 million, while long liquidations were about $36.83 million. For ETH, short liquidations totaled about $141 million, while long liquidations were about $55.05 million. For both BTC and ETH, short liquidations significantly exceeded long liquidations, indicating that the core driver of this price increase is not momentum long chasing, but forced exits of previously mispositioned shorts.
Looking at the daily structure, BTC saw the most concentrated short liquidations on March 4 and March 16, at about $30.18 million and $10.16 million respectively. ETH experienced more intense short liquidations on March 13 and March 16, with short liquidations on March 16 alone reaching about $45.64 million. These data confirm a typical feature of the current market. BTC completes direction confirmation first. ETH then expands gains through stronger short covering and leverage amplification. For the market, this type of liquidation structure is generally more constructive than concentrated long liquidations at high levels, as it indicates that the rise is driven more by short squeezing and has not yet formed systemic long crowding. As long as liquidations do not shift to being dominated by long positions, the trend is likely to remain in a relatively healthy continuation phase.
II. Quantitative Analysis
Over the past two weeks, the market structure has been more suitable for trend breakouts rather than simple mean reversion. On one hand, the rapid deleveraging in early March led to the reconvergence of short- and mid-term moving averages. On the other hand, ETF inflows, non-overheated funding rates, and continuous short covering have made it easier for prices to continue in the breakout direction after compression.
2.1 Strategy Overview
The core of the moving average cluster breakout strategy is not to predict tops or bottoms, but to identify the release phase after compression when the trend is not yet overcrowded. When prices repeatedly converge around multiple moving averages over a period of time, it indicates that market divergence is weakening. Once price makes an effective breakout above or below the moving average band, the trend is more likely to enter a one-sided expansion.
In the current market, BTC first took on the role of stabilizing the price center over the past two weeks, while ETH assumed the role of amplifying elasticity in the second stage. This makes the strategy well suited to capture the current structural opportunities. This model can track both the deleveraging pullback in early March and the trend recovery after March 9. In other words, it is not only effective in rising markets, but has greater advantages in a structure that first clears leverage and then develops a trend. This is also why it is more suitable for the current market environment than simple momentum-chasing models.
2.2 Core Parameter Settings
Figure 8: Dense Moving Average Breakout Strategy
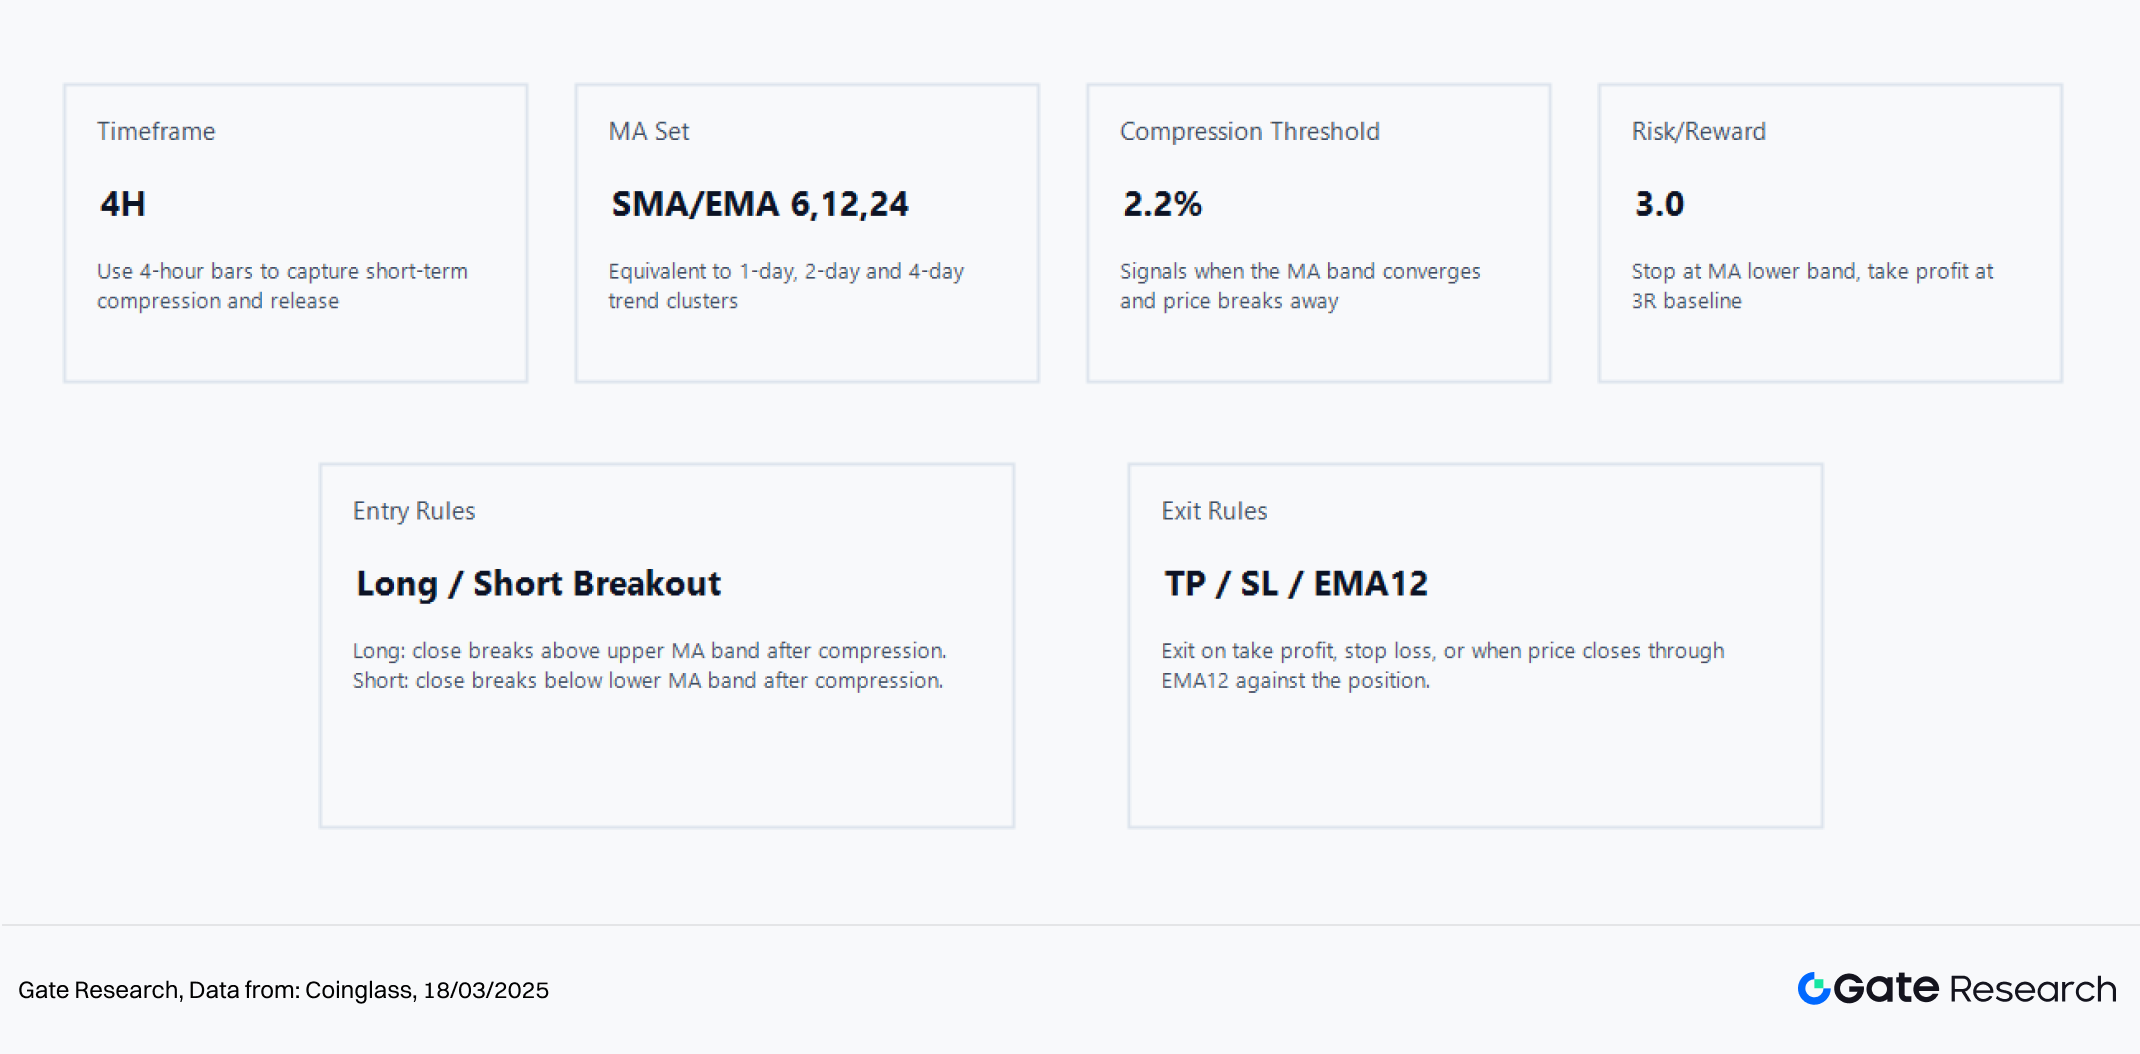
This quantitative analysis uses 4H-level data. The moving average cluster adopts a combination of SMA/EMA 6, 12, and 24, corresponding to short- and mid-term trends of approximately 1 day, 2 days, and 4 days. The baseline parameters are set with a compression threshold of 2.2% and a risk-reward ratio of 3.0. The advantage of this setup is that signals are sufficiently sensitive while avoiding excessive noise from overly wide thresholds. Compared with general frameworks, this approach places more emphasis on short-cycle real-time monitoring, so the parameters are intentionally shortened to better match recent shifts in market rhythm.
The entry logic of the strategy is very clear. After price completes compression within the moving average band, a valid close above the upper bound triggers a long signal. A break below the lower bound triggers a short signal. Exits are handled through a combination of take-profit, stop-loss, and an opposite close relative to EMA12. This design balances trend-following and risk control. It avoids unconditional holding during choppy conditions and also prevents premature exits during strong trends.
2.3 Strategy Logic and Mechanism
Figure 9: BTC 4H Dense MA Breakout: Live Signal Review
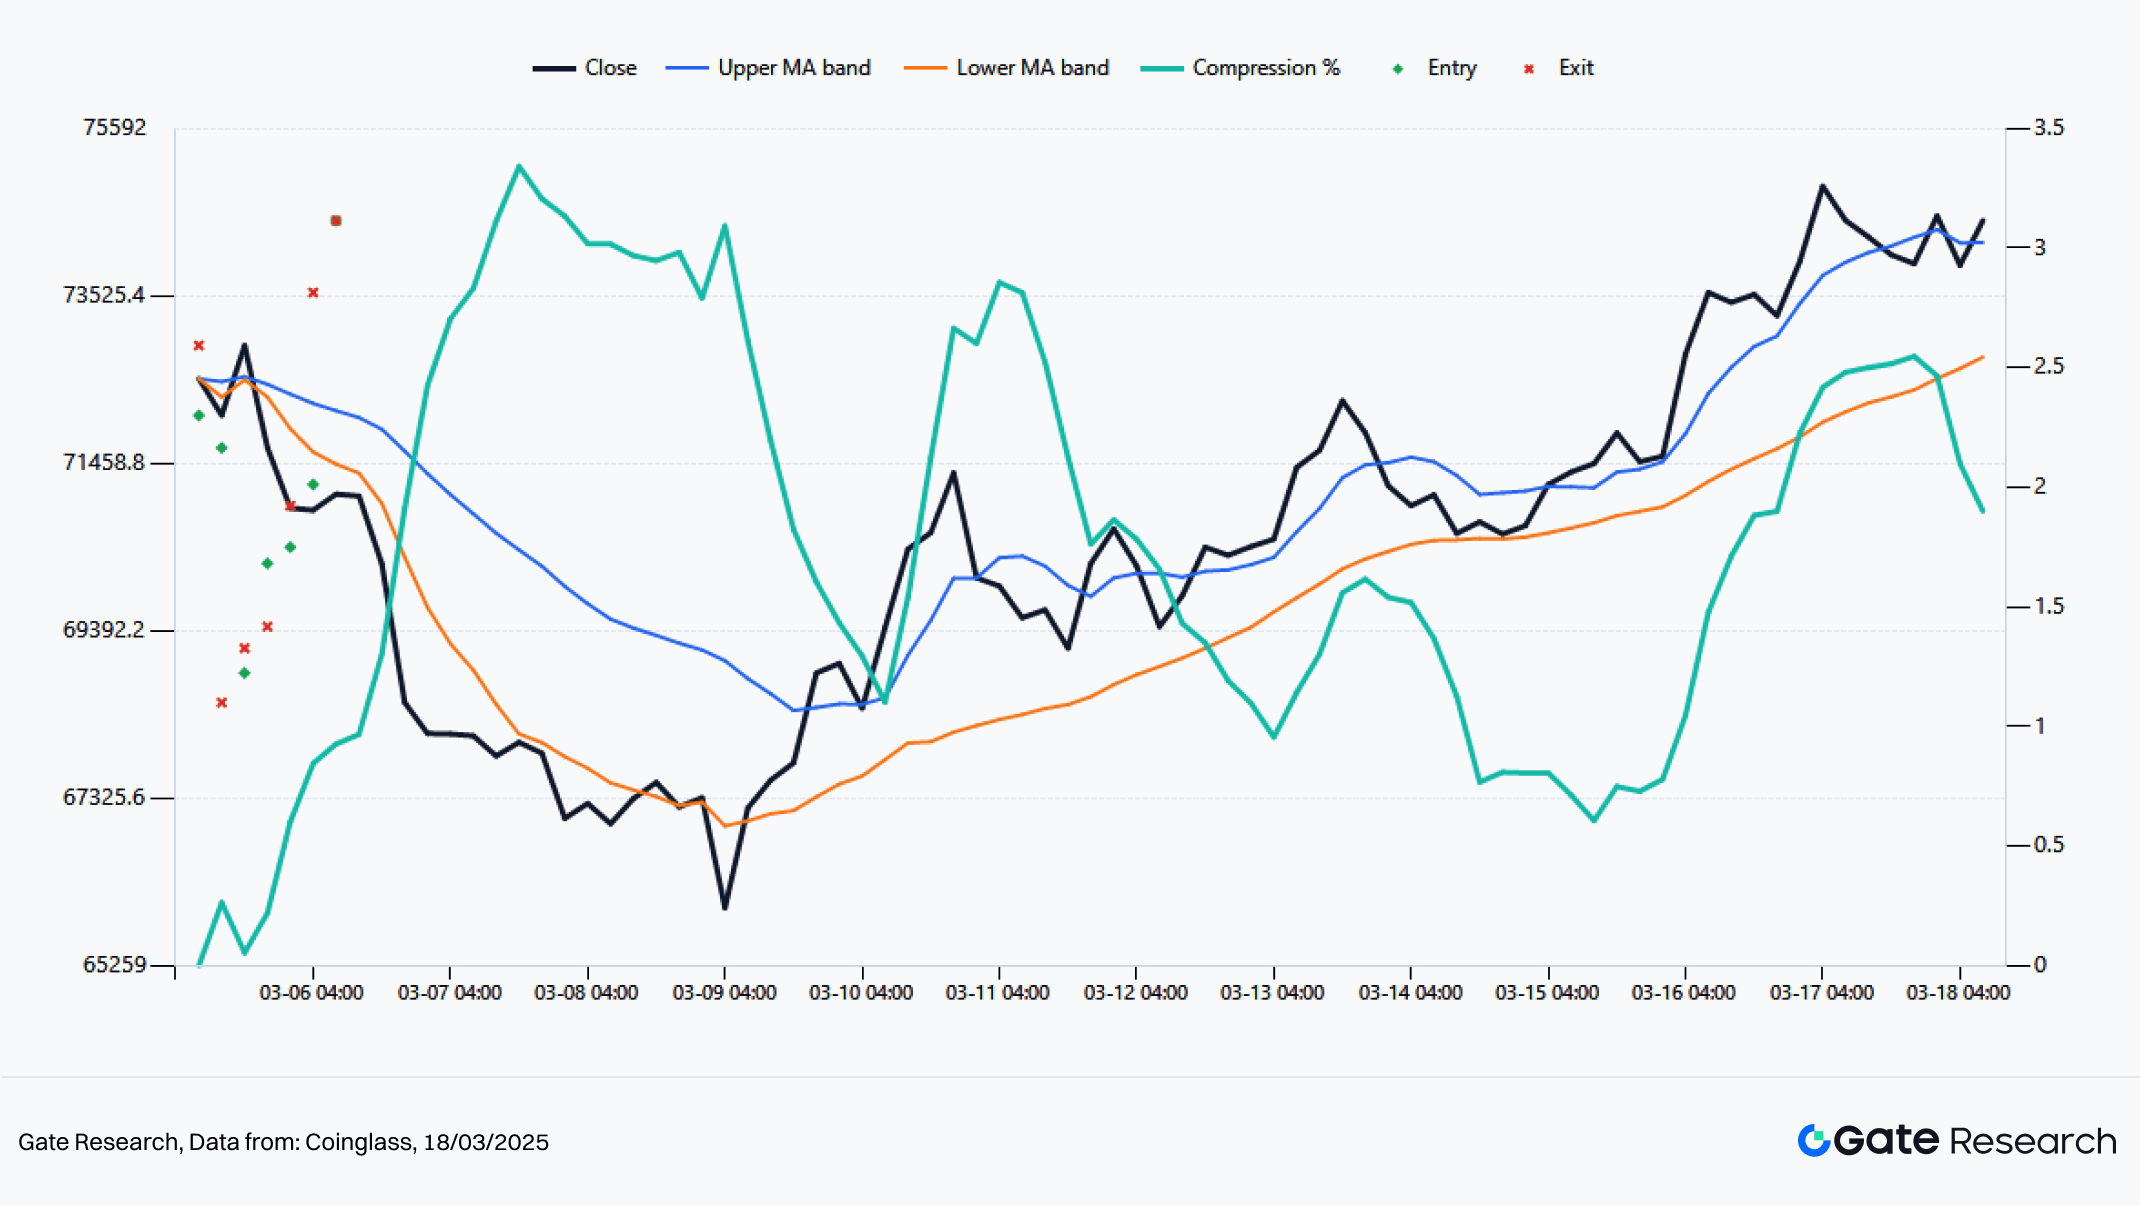
From BTC’s 4-hour signals, under the baseline parameters, the model generated a total of 7 trades over the past two weeks. The cumulative return of the strategy was about 6.84%. The maximum drawdown was about 4.25%. The win rate was about 57.14%. The two most critical trades occurred during the short continuation at 20:00 on March 5 and the long breakout from 04:00 on March 15 to 08:00 on March 16. The former captured the late stage of deleveraging, with a return of about 4.59% on a single trade. The latter corresponded to BTC reclaiming the upper bound of the moving average band, with a return of about 3.33% on a single trade. This further shows that BTC in the current environment behaves more like a trend-confirmation asset. Its trading signals are more stable. Single-trade volatility is relatively contained. Continuity is stronger.
Figure 10: ETH 4H Dense MA Breakout: Live Signal Review
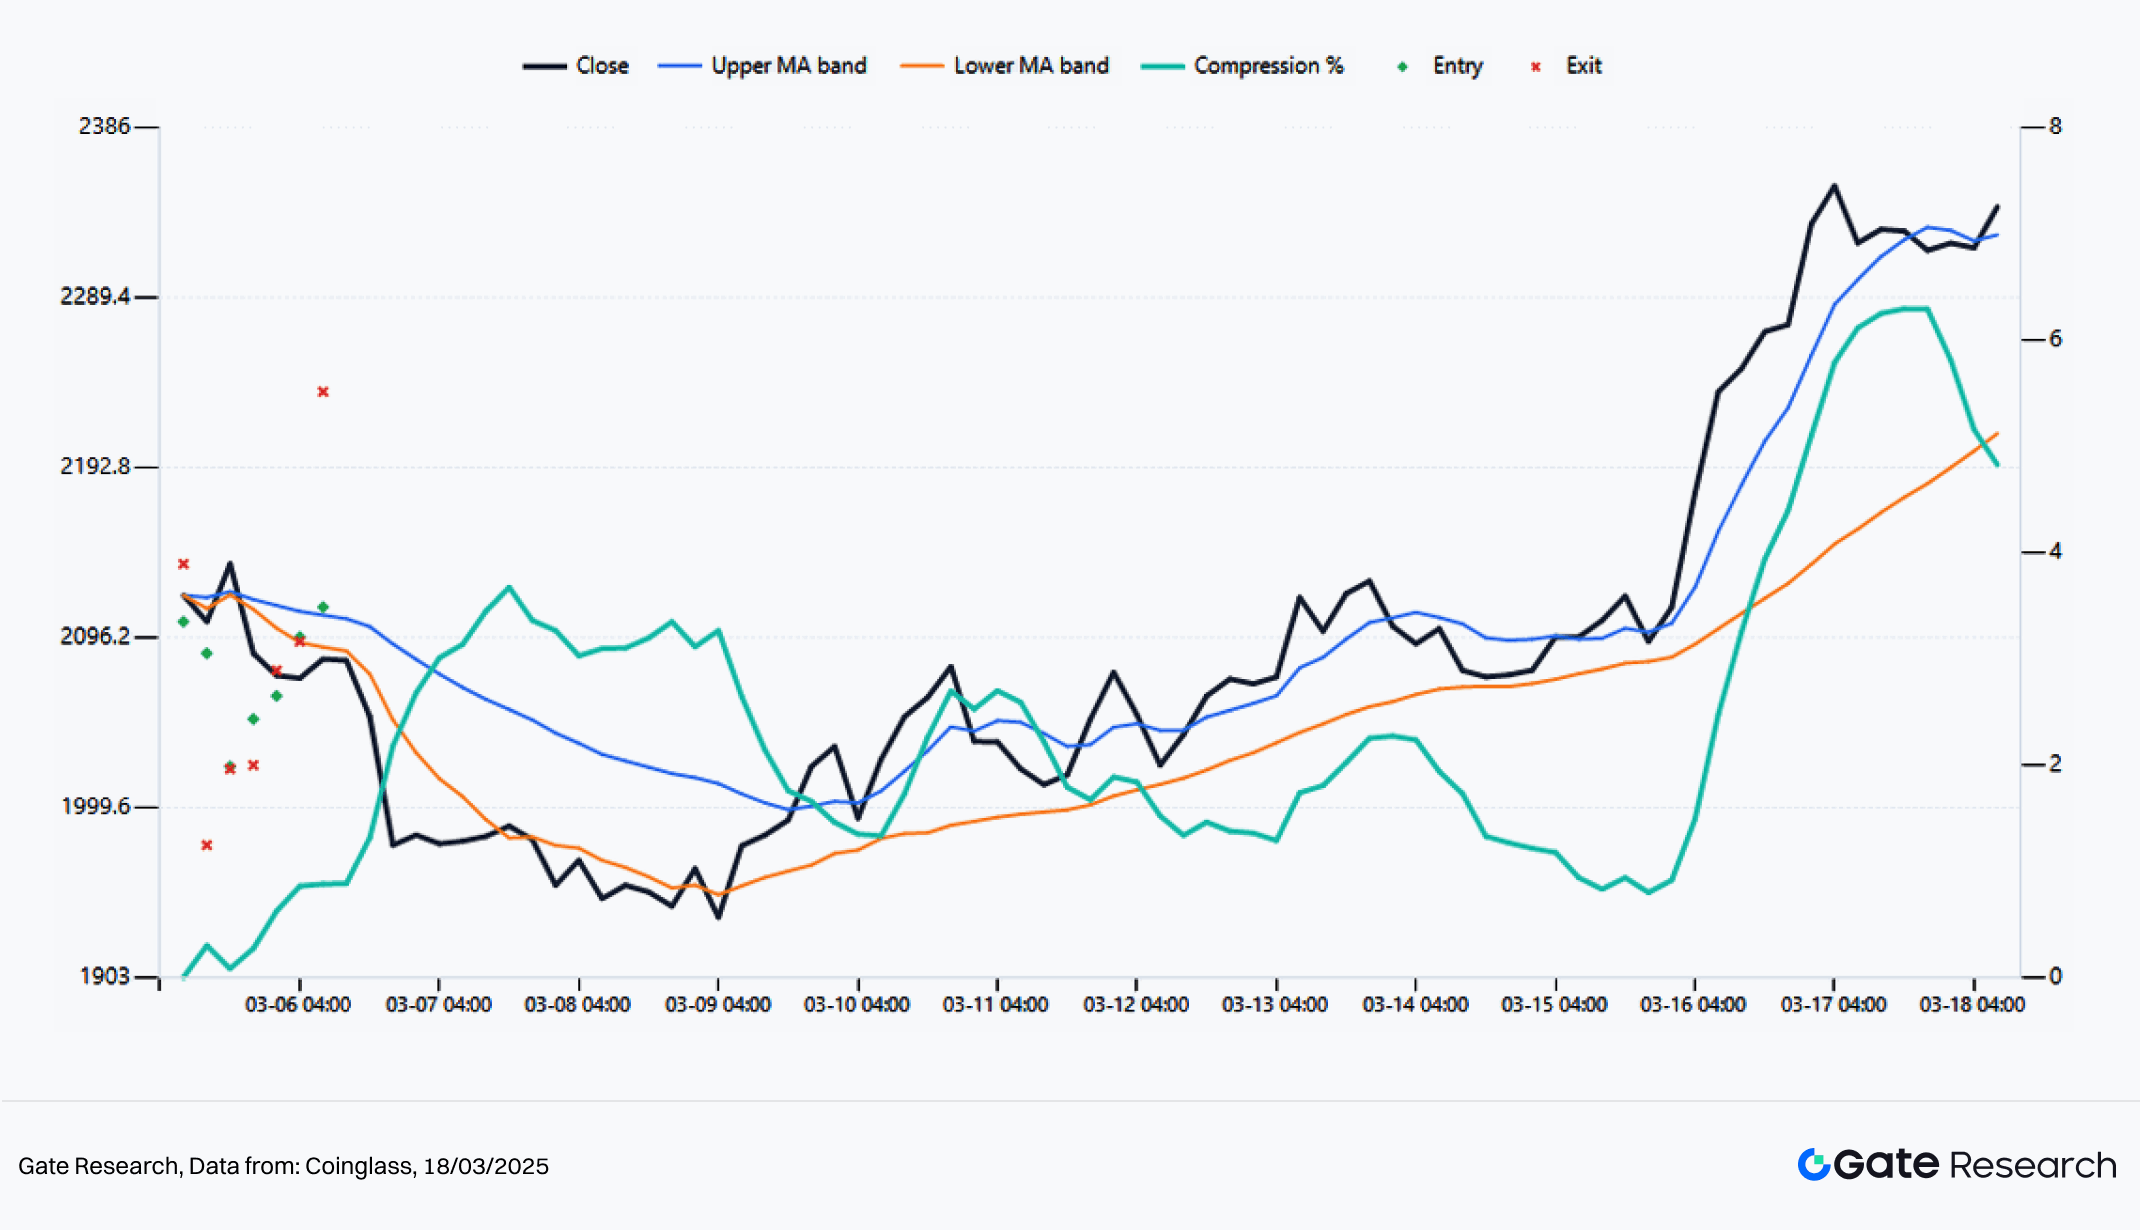
The signal structure of ETH is more aggressive. Under the same baseline parameters, ETH also generated 7 trades, but the cumulative return reached 9.05%, with a maximum drawdown of only 4.04%, clearly outperforming BTC. It is worth noting that ETH’s win rate was only 42.86%, lower than BTC, yet its returns were higher. This is because its trend legs are longer and the profit and loss distribution is more skewed to the right tail. The most typical trade occurred from 00:00 to 08:00 on March 16, when price expanded rapidly along the breakout direction, delivering about 5.79% in a single trade. This is consistent with the conclusions in the market overview section. ETH is not winning through a higher win rate, but through stronger trend continuation and greater single-trade return elasticity.
2.4 Practical Application Example: Parameter Sensitivity and Performance Analysis
Figure 11: Top 5 Parameter Clusters by Average BTC/ETH Strategy Return
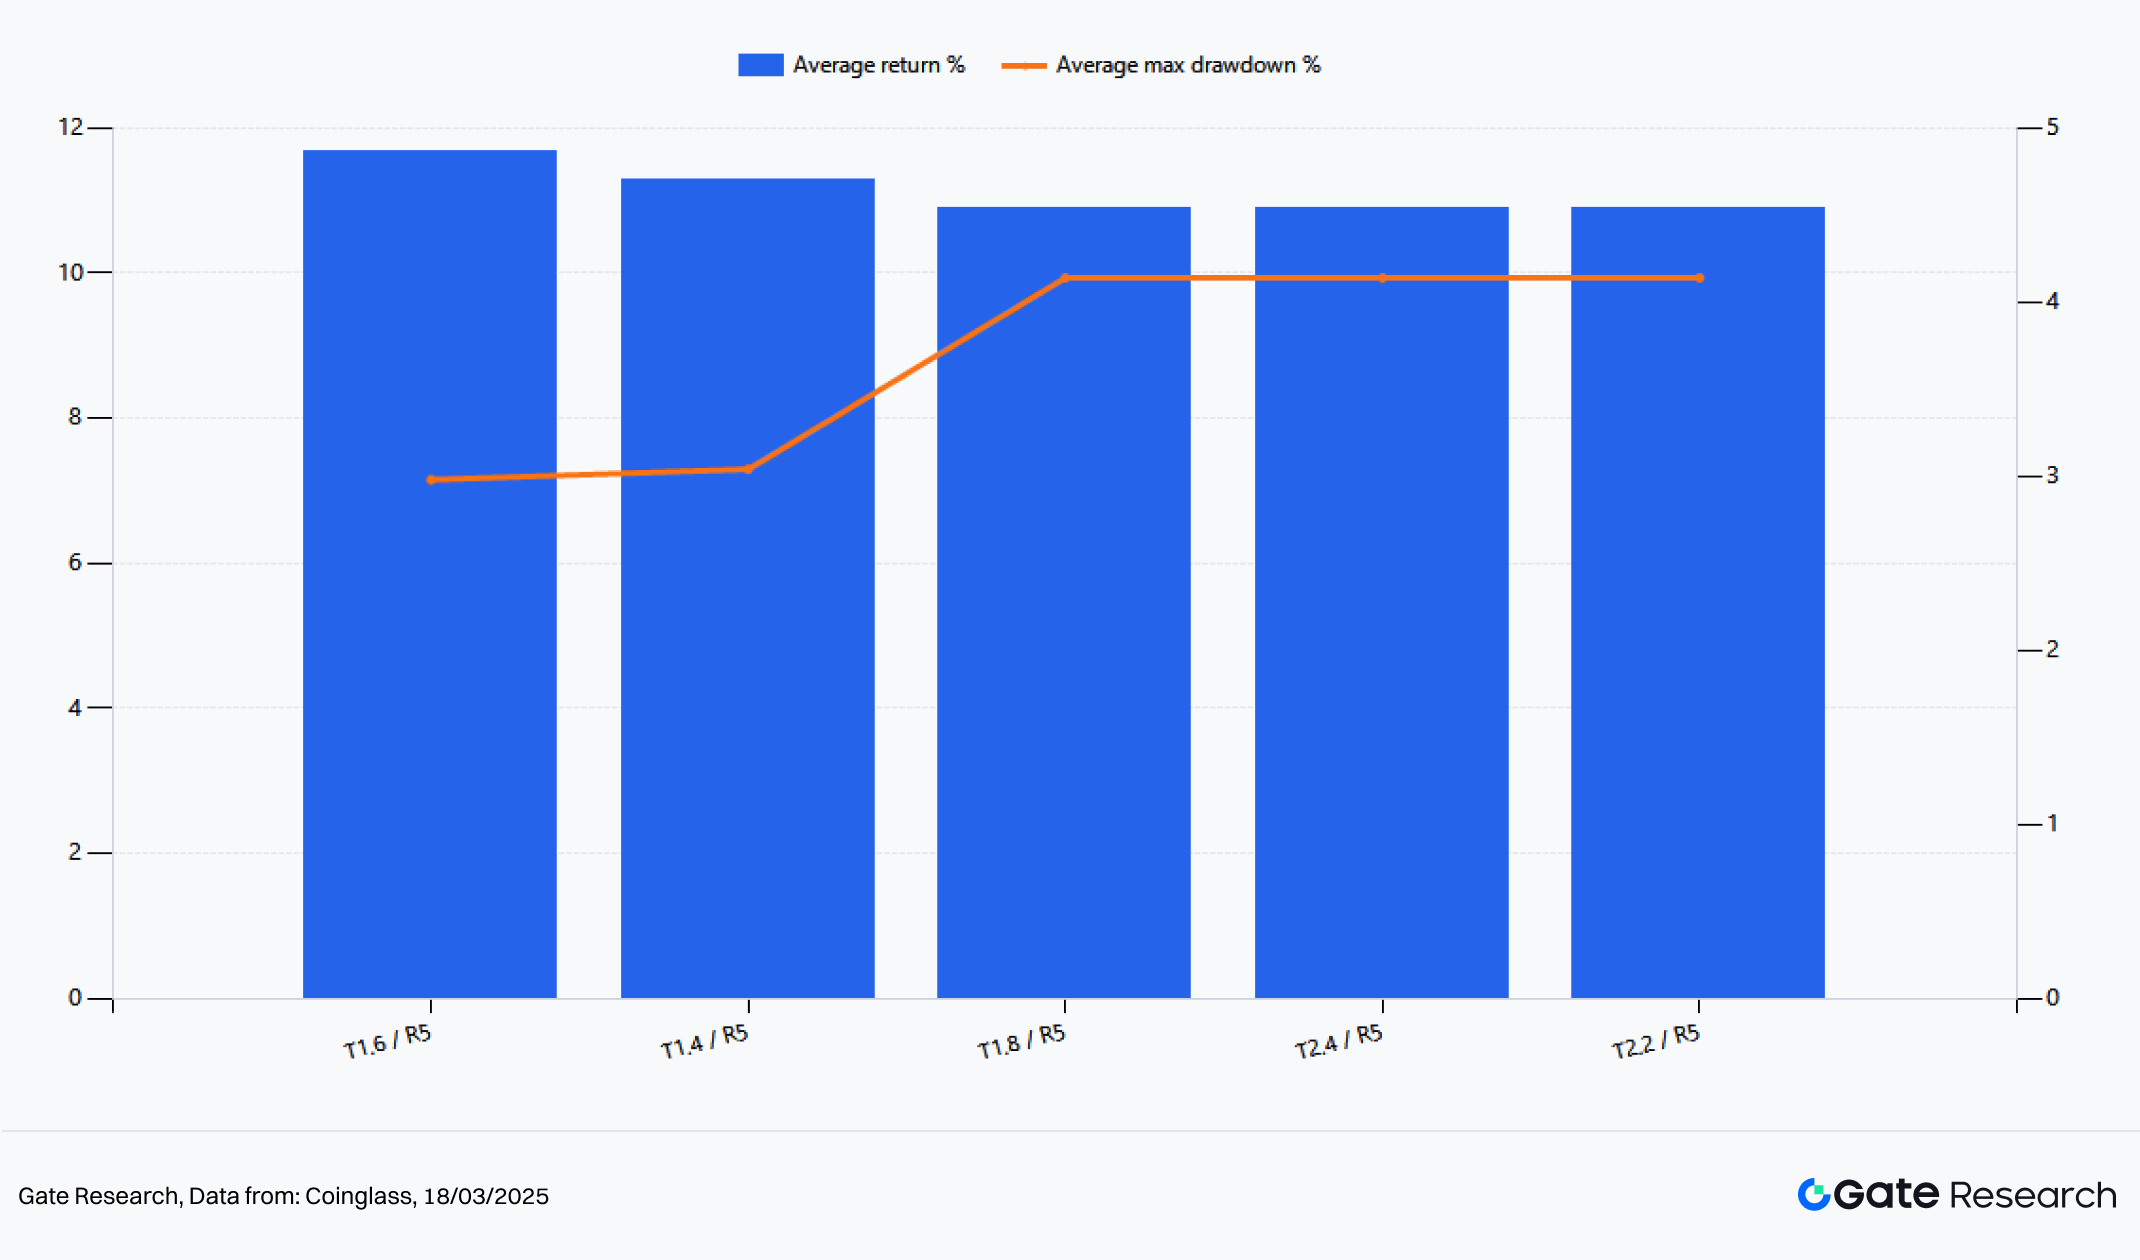
To avoid relying on случай results under a single parameter setting, this analysis conducted a grid scan over compression thresholds from 1.4% to 3.0% and risk-reward ratios from 2.0 to 5.0, using the average returns of BTC and ETH as the ranking basis. The results show that the top five parameter clusters are almost all concentrated in the threshold range of 1.4% to 2.4% and around a risk-reward ratio of 5. The optimal combination is T1.6 / R5, where BTC’s two-week strategy return is about 11.41%, ETH is about 11.94%, the average return reaches 11.68%, and the average maximum drawdown is only 2.98%. This indicates that the most profitable approach in the current market is not loosening conditions or increasing trade frequency, but tightening the compression threshold and letting profits run.
The market over the past two weeks has not been characterized by frequent false breakouts, but by a few effective breakouts followed by sustained trend continuation. Therefore, a narrower compression filter helps eliminate choppy noise, while a higher risk-reward ratio preserves most of the profit from trend legs. In other words, the current market rewards strategies that trade less but hold longer, rather than those that frequently switch positions.
Figure 12: Best Strategy vs Buy-and-Hold (Past 2 Weeks)
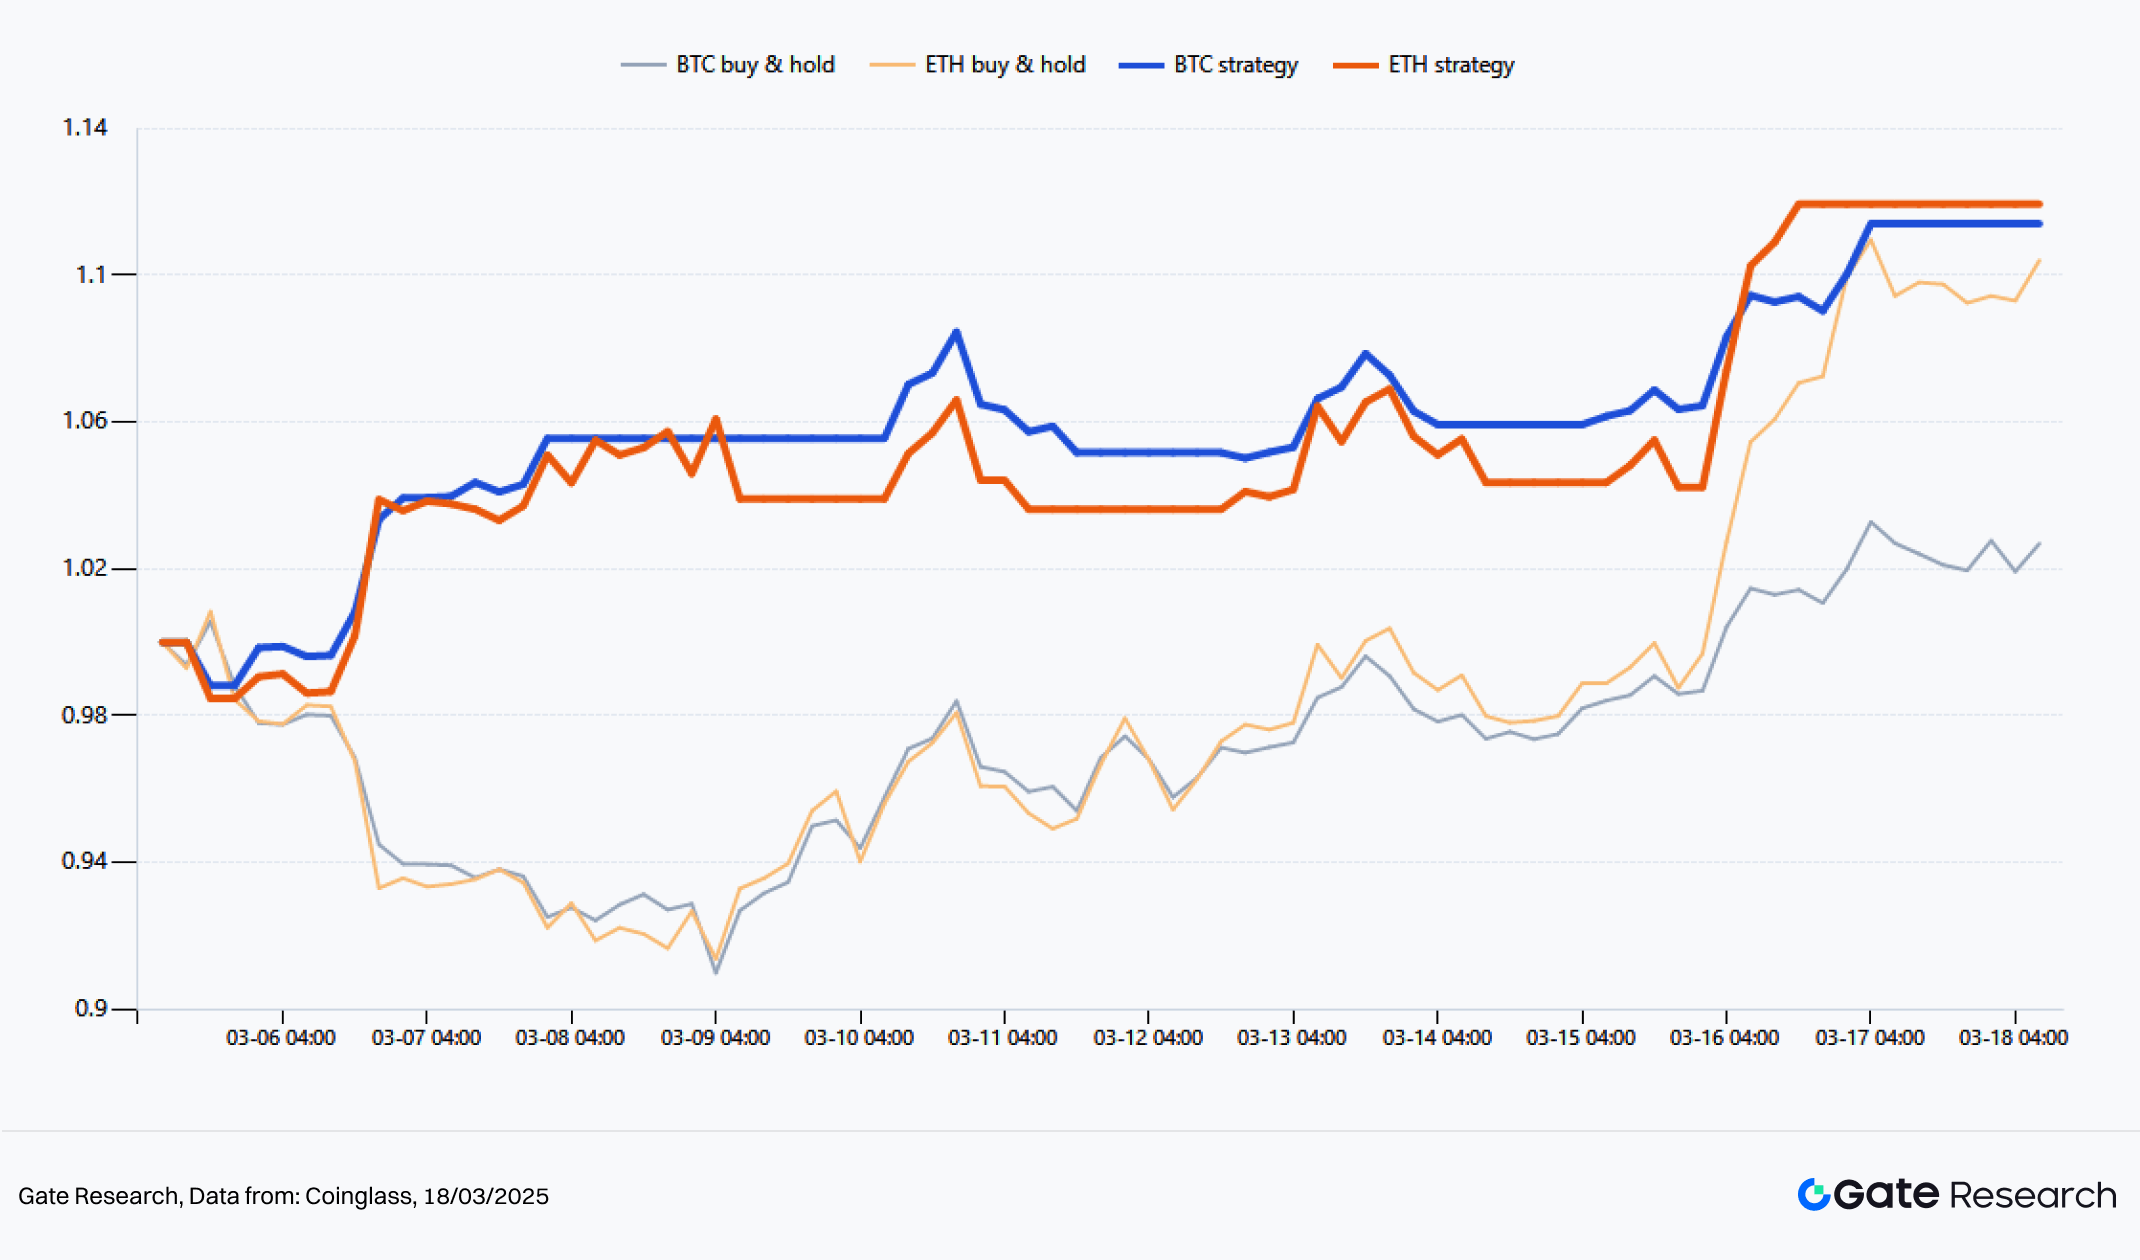
A further comparison between the optimal parameter cluster and spot holding shows that the strategy’s net value outperformed buy-and-hold for both BTC and ETH. Over the past two weeks, BTC spot rose about 2.2%, while the optimal parameter strategy delivered about 11.41%. ETH spot rose about 9.5%, while the strategy delivered about 11.94%. BTC shows more significant excess return because the model not only captured the subsequent upward move but also effectively utilized the short segment in early March. ETH preserved most of the upside while avoiding mid-period pullbacks as much as possible. In comparison, the main value of this strategy in the current market environment is not precise top or bottom picking, but extracting cleaner effective segments of the trend.
2.5 Strategy Summary
Combining real-time signals and parameter scan results from the past two weeks, three conclusions can be drawn. First, the current market is more suitable for a post-compression breakout trend framework rather than counter-trend mean reversion. Second, BTC serves as the trend anchor, while ETH acts as the return amplifier, so the same strategy often exhibits greater elasticity on ETH. Third, based on recent parameter sensitivity, the market currently favors combinations of narrower compression thresholds and higher profit targets, which aligns with the characteristics of low crowding and more true breakouts than false ones.
As a standard parameter for reporting, 2.2% / 3.0 is a more balanced and interpretable baseline. As a tactical trading parameter, the best-performing range over the past two weeks is around 1.6% / 5.0, which is more suitable during clear trends and volatility expansion phases. It should be emphasized that this optimization result only applies to the recent two-week window and is suitable for identifying the current market state. It should not directly replace long-cycle, full-market backtesting parameters. Overall, the market has shifted from sideways compression to trend release, and quantitative strategies should accordingly shift from defensive to trend-following approaches.
III. Conclusion
Based on price action, derivatives, ETF flows, and quantitative signals over the past two weeks, the current market is not a simple rebound but a typical structural shift. The rapid deleveraging in early March compressed short- and mid-term moving averages and positioning. BTC then led the recovery of the price center. ETH followed by amplifying elasticity as risk appetite improved and short covering accelerated.
At the market level, BTC serves as the trend anchor, while ETH functions as the return amplifier. At the capital flow level, the recovery of ETF net inflows, moderate funding rates, and short-dominated liquidations together form the foundation for the continuation of the current trend.
The conclusions from the quantitative section are highly consistent with the market structure. Over the past two weeks, the 4-hour moving average cluster breakout strategy has been able to consistently identify effective post-compression trend segments in both BTC and ETH. Parameter scans show that the current market favors narrower compression thresholds and higher risk-reward ratios. The current environment rewards trend-following and profit expansion rather than high-frequency switching or counter-trend trading. For ongoing tracking, 2.2% / 3.0 can serve as a balanced baseline parameter, while 1.6% / 5.0 is more suitable as a tactical reference during clear trend phases.
Looking ahead, whether the market can sustain trend release depends on three factors. First, whether ETF flows continue to show net inflows. Second, whether funding rates remain moderate rather than heating up rapidly. Third, whether the liquidation structure continues to be dominated by short covering rather than shifting to crowded long liquidations. If these conditions remain unchanged, BTC and ETH are likely to continue their recovery along the current trajectory. BTC is more inclined toward steady upward movement, while ETH retains stronger elasticity. Overall, the market has transitioned from a defensive recovery phase to a trend-following trading environment, and quantitative strategies should shift accordingly from range-based to trend-based approaches.
References:
-
Gate, https://www.gate.com/trade/BTC_USDT
-
Farside BTC ETF Flows, https://farside.co.uk/btc/
-
CoinGecko, https://api.coingecko.com/api/v3/global
-
Alternative.me, https://api.alternative.me/fng/?limit=1
Gate Research is a comprehensive blockchain and cryptocurrency research platform that provides deep content for readers, including technical analysis, market insights, industry research, trend forecasting, and macroeconomic policy analysis.
Disclaimer
Investing in cryptocurrency markets involves high risk. Users are advised to conduct their own research and fully understand the nature of the assets and products before making any investment decisions. Gate is not responsible for any losses or damages arising from such decisions.
Share


Related Articles

Gate Research: 2024 Cryptocurrency Market Review and 2025 Trend Forecast

Gate Research: BTC Breaks $100K Milestone, November Crypto Trading Volume Exceeds $10 Trillion For First Time

Gate Research-A Study on the Correlation Between Memecoin and Bitcoin Prices

Gate Research: Web3 Industry Funding Report - November 2024

Gate Research: October Crypto Market Review